The latest edition of County Business Patterns was just released, which includes 2021 data (gulp!)—meaning it reflects the businesses that were lost due to COVID. However, it doesn’t seem to be that bad.
NAICS 32311 is defined by the Census as:
This industry comprises establishments primarily engaged in printing on apparel and textile products, paper, metal, glass, plastics, and other materials, except fabric (grey goods). The printing processes employed include, but are not limited to, lithographic, gravure, screen, flexographic, digital, and letterpress. Establishments in this industry do not manufacture the stock that they print, but may perform postprinting activities, such as folding, cutting, or laminating the materials they print, and mailing.
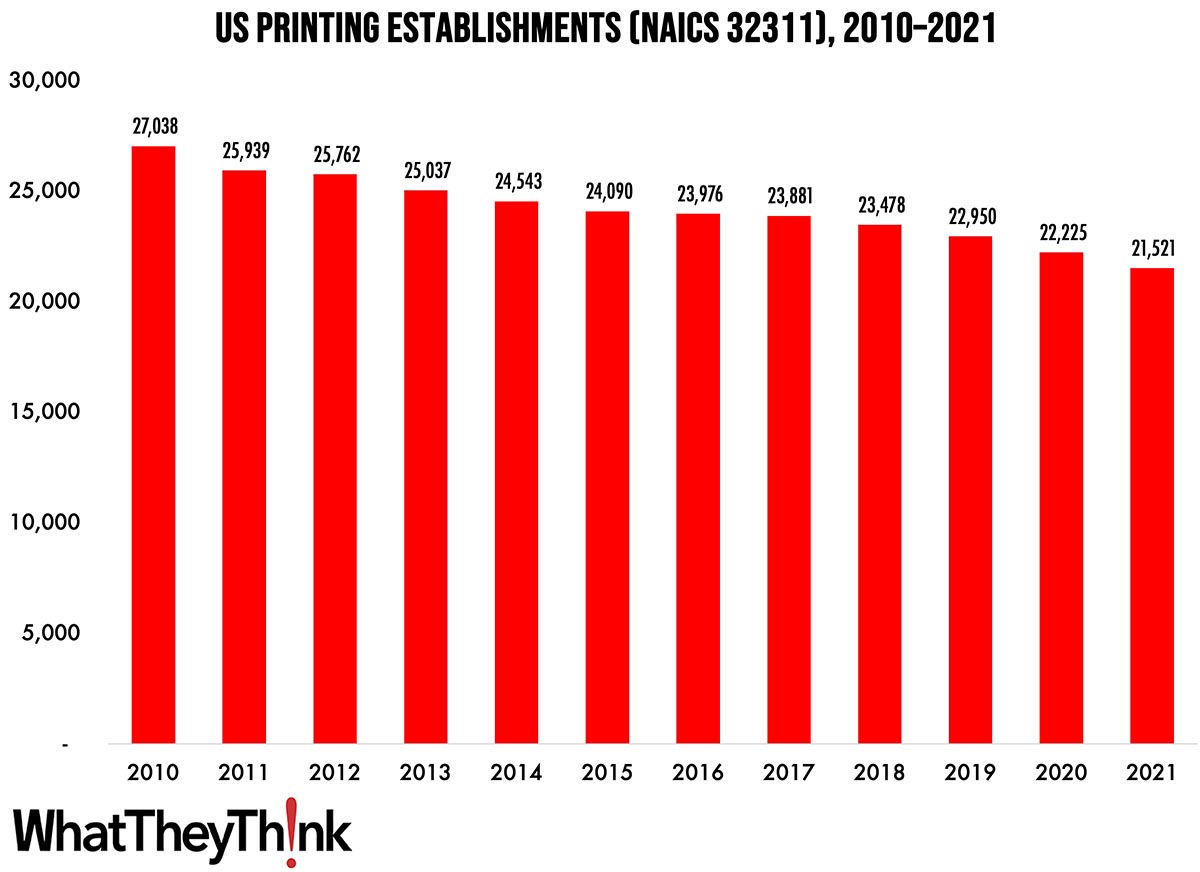
As 2021 began, there were 21,521 establishments in NAICS 32311 (Printing). This represents a decline of 20% since 2010. The biggest declines were in the early years of the decade, thanks to the Great Recession—from 2010 to 2011, establishments declined by 4%; from 2014 to 2015, the decline was only 2%. Consolidation picked up toward the end of the decade, with establishments declining 5% from 2018 to 2020. The decline from 2020 to 2021 was 3%.
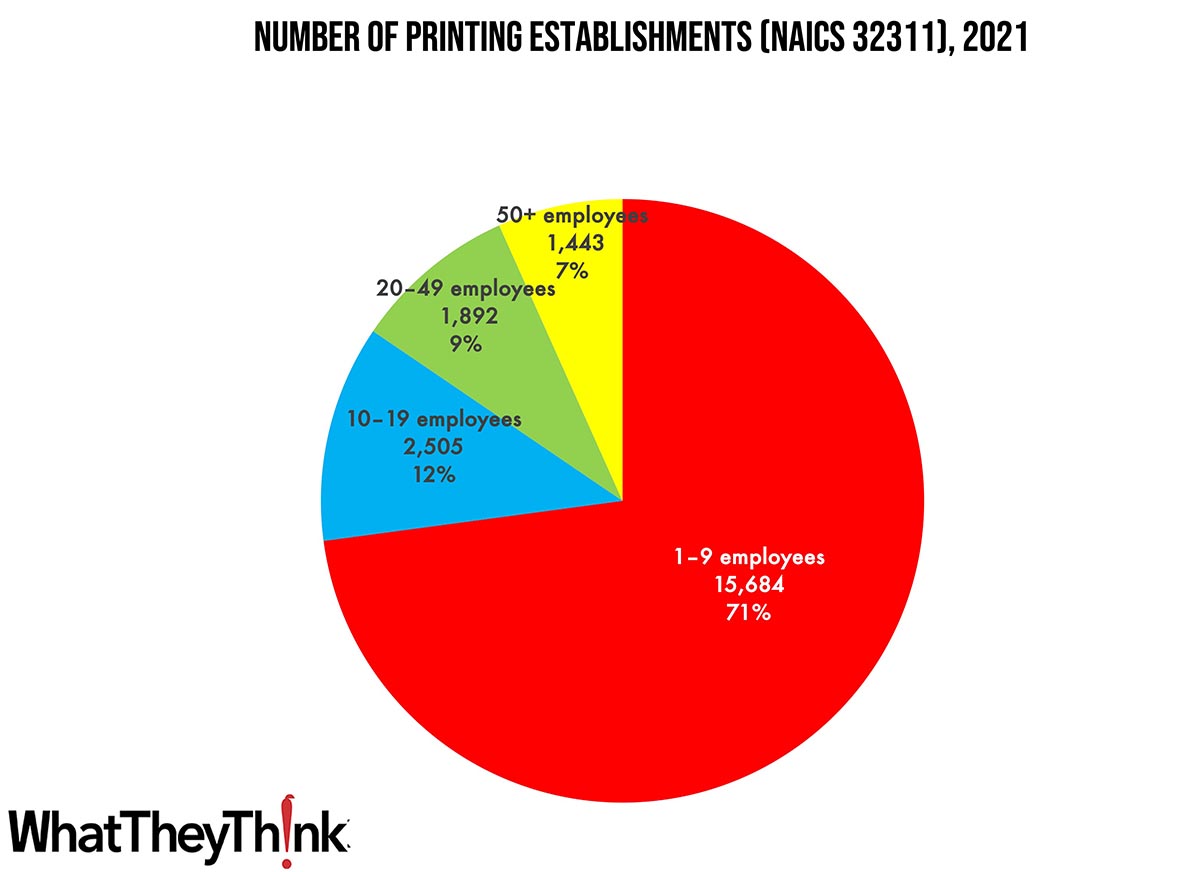
Small shops (1 to 9 employees) still comprise the bulk of the industry, accounting for 71% of all establishments. The largest shops account for only 7% of industry establishments with mid-size shops accounting for about one-fourth of establishments. These percentages have not varied substantially since at least as far back as 2010.
These counts are based on data from the Census Bureau’s County Business Patterns. Throughout this year, we will be updating these data series with the latest CBP figures. County Business Patterns includes other data, such as number of employees, payroll, etc. These counts are broken down by commercial printing business classification (based on NAICS, the North American Industrial Classification System):
- 323111 (Commercial Printing, except Screen and Books)
- 323113 (Commercial Screen Printing)
- 323117 (Books Printing)
- 32312 (Support Activities for Printing—aka prepress and postpress services)
These data, and the overarching year-to-year trends, like other demographic data, can be used not only for business planning and forecasting, but also sales and marketing resource allocation.
(And, as per Frank’s comments in today’s video, we have been wrestling with these issues for years.)
This Macro Moment…
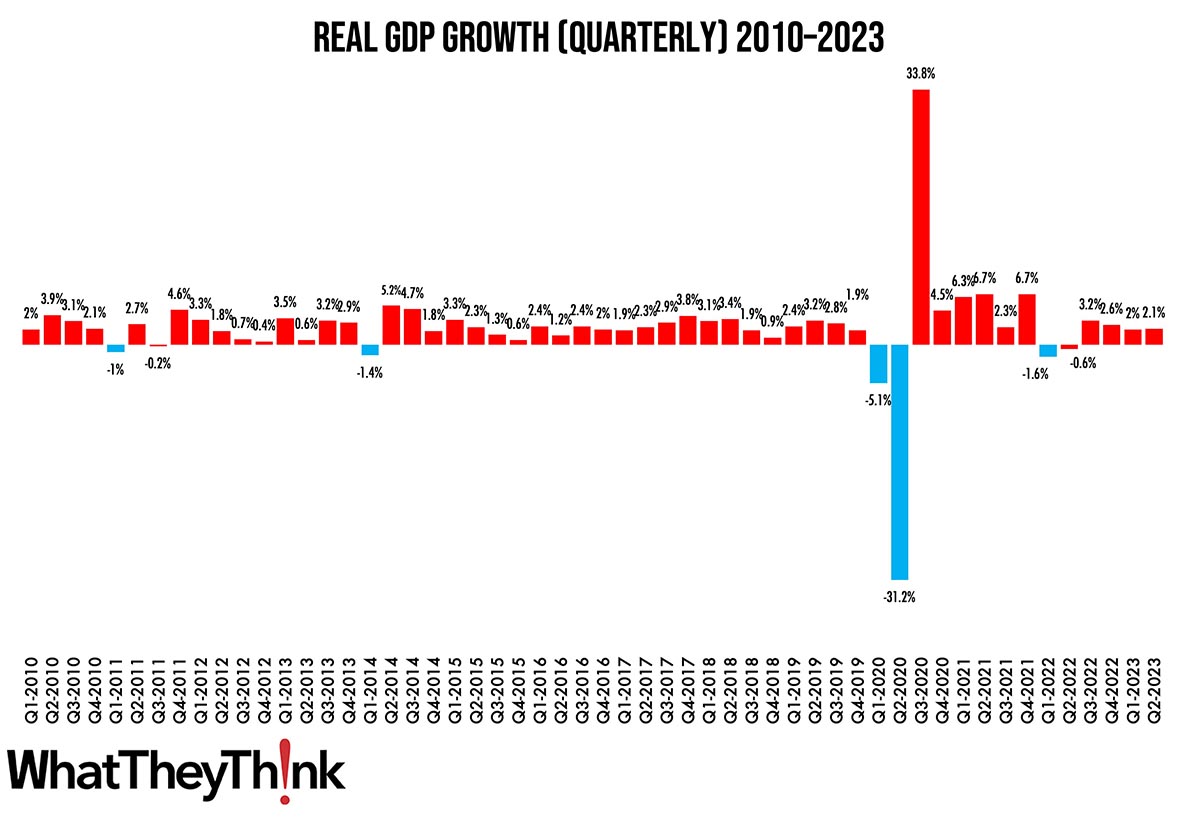
The Bureau of Economic Analysis (BEA) released its second estimate of Q2 2023 GDP on Wednesday.
Real gross domestic product (GDP) increased at an annual rate of 2.1 percent in the second quarter of 2023 (table 1), according to the "second" estimate released by the Bureau of Economic Analysis. In the first quarter, real GDP increased 2.0 percent.
The first estimate had Q2 GDP up 2.4%, so this represents a downward revision.
The updated estimates primarily reflected downward revisions to private inventory investment and nonresidential fixed investment that were partly offset by an upward revision to state and local government spending.
Source: Bureau of Economic Analysis
That’s a little disappointing, but still pretty good.


