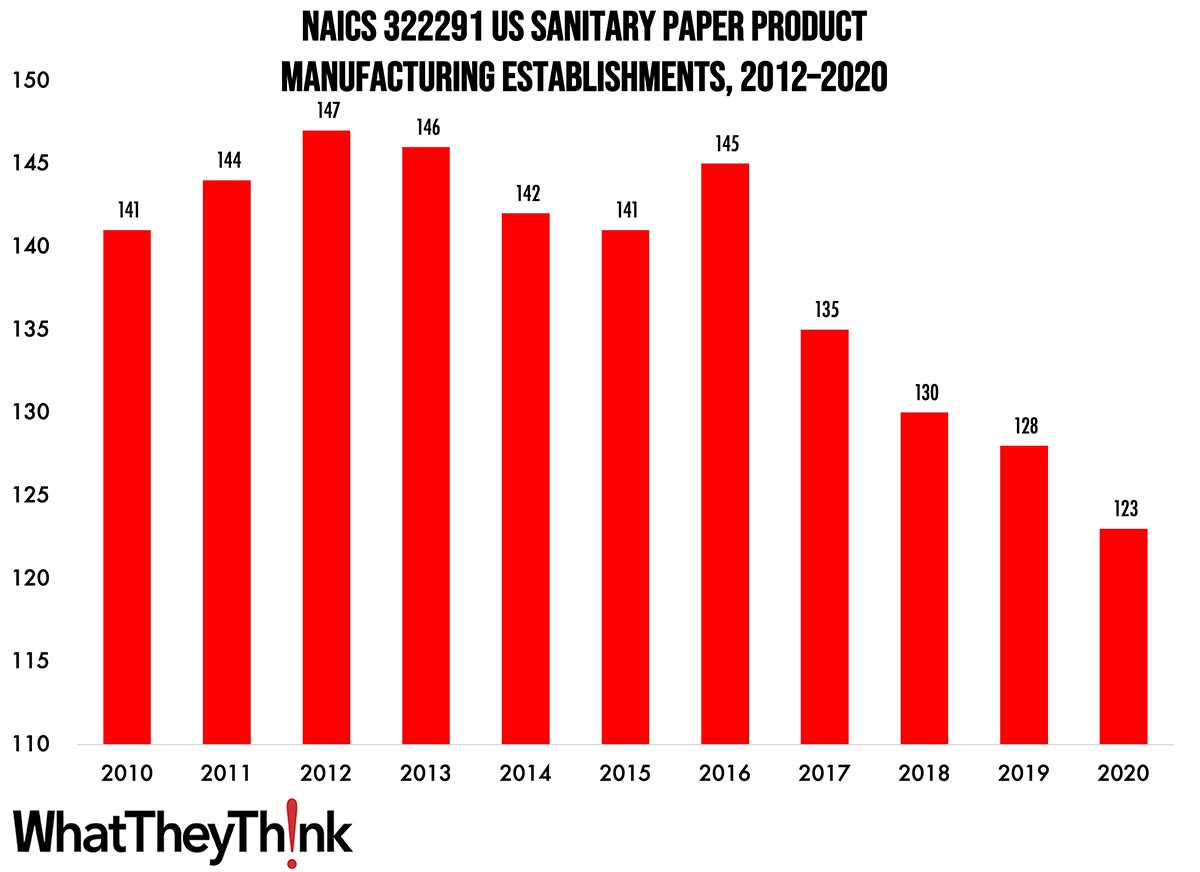
According to County Business Patterns, in 2010, there were 123 establishments in NAICS 322291 (Sanitary Paper Product Manufacturing). This NAICS category has declined steadily over the course of the decade.
The Bureau of the Census definition for this business classification:
This U.S. industry comprises establishments primarily engaged in converting purchased sanitary paper stock or wadding into sanitary paper products, such as facial tissues, handkerchiefs, table napkins, toilet paper, towels, disposable diapers, sanitary napkins, and tampons.
Although the sanitary paper product market is a mature one, with few truly new products coming to market and few avenues for growth, it’s still not one to sneeze at. The market is dominated by a few very large manufacturers with little room for newcomers—and the establishment data reflect no small amount of consolidation.
Products are broadly divided into “consumer” and “commercial and industrial,” the latter of which is intended for schools, hospitals, or offices. Although the distinction is rarely important, in 2020, the inability of manufacturers to quickly pivot from the latter to the former led to the infamous toilet paper shortages during the pandemic lockdown.
These products tend to be “non-discretionary,” in that there is very little that will stimulate (or depress) usage/sales, save for a particularly bad cold/flu/allergy season (or a pandemic), perhaps. The adult incontinence product category is perhaps the most recent new product category, and this market depends on population demographics, which currently favor growth. A baby boom would favor growth at the other end of the incontinence spectrum. The industry also tends to be highly integrated, so the major companies that manufacture the raw materials also convert those into the final products.
Interestingly, small changes in these categories can have substantial environmental impacts—and sometimes for the better. UK supermarket chain Sainsbury reduced the width of a toilet paper roll by 11mm, allowing more rolls to be fit into a delivery van and eliminating 500 van trips a year—saving 140 tons of CO2 annually in reduced transport and materials.
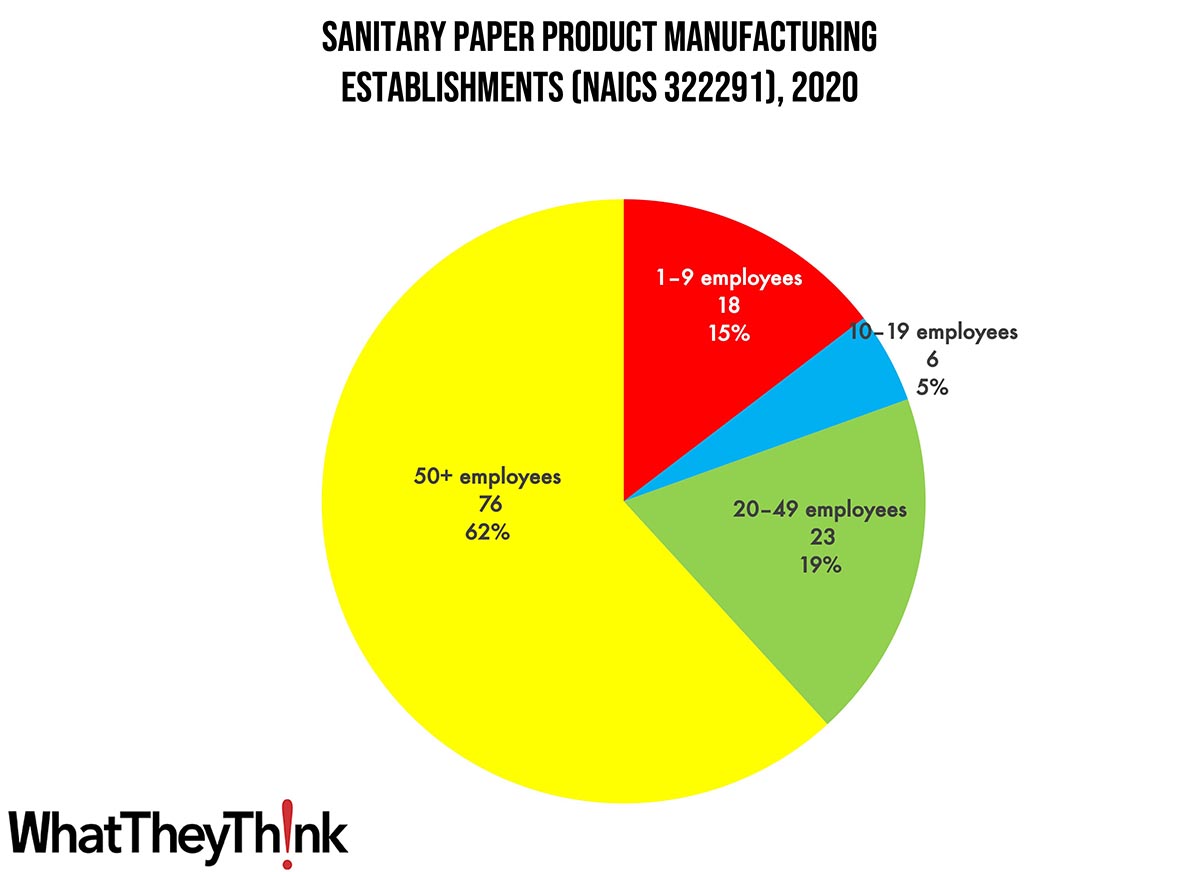
Establishments in this category are fairly concentrated at the large end. Small stationery product manufacturers (1 to 9 employees) account for 15% of all establishments, large manufacturers (50+ employees) account for 62% of establishments, and mid-size establishments (10–49 employees) account for 19%.
These counts are based on data from the Census Bureau’s County Business Patterns. Every other week, we update these data series with the latest figures. These counts are broken down by printing business classification (based on NAICS, the North American Industrial Classification System).
Next up, the last of the converting categories:
- 322299 All Other Converted Paper Product Manufacturing
To clarify what is included in the 2020 CBP, establishment counts represent the number of locations with paid employees at any time during the year. If an establishment existed at any point during the year, it would be included in the CBP count of the number of establishments for 2020 CBP. Thus, businesses lost during the COVID pandemic won’t be accounted for until the 2021 CBP.
That said, 2021 County Business Patterns has just been released! After we finish the final 322 category in a fortnight’s time, we are going to circle back to 323 and see what the pandemic hath wrought. Start drinking now.
These data, and the overarching year-to-year trends, like other demographic data, can be used not only for business planning and forecasting, but also sales and marketing resource allocation.
This Macro Moment…
Every so often, we have a look at the Census Bureau’s Business Formation Statistics which, ever since the pandemic, have been exceedingly high. In June 2023, new business applications were 465,906, up 6.2% from May. This of course doesn’t mean that they will all be successful. So the Census Bureau breaks out “high propensity” or projected business applications:
Projected Business Formations (within 4 quarters) for June 2023, adjusted for seasonal variation, were 32,148, an increase of 4.0 percent compared to May 2023. The projected business formations are forward looking, providing an estimate of the number of new business startups that will appear from the cohort of business applications in a given month. It does not provide an estimate of the total number of business startups that appeared within a specific month. In other words, the Census Bureau is projecting that 32,148 new business startups with payroll tax liabilities will form within 4 quarters of application from all the business applications filed during June 2023.
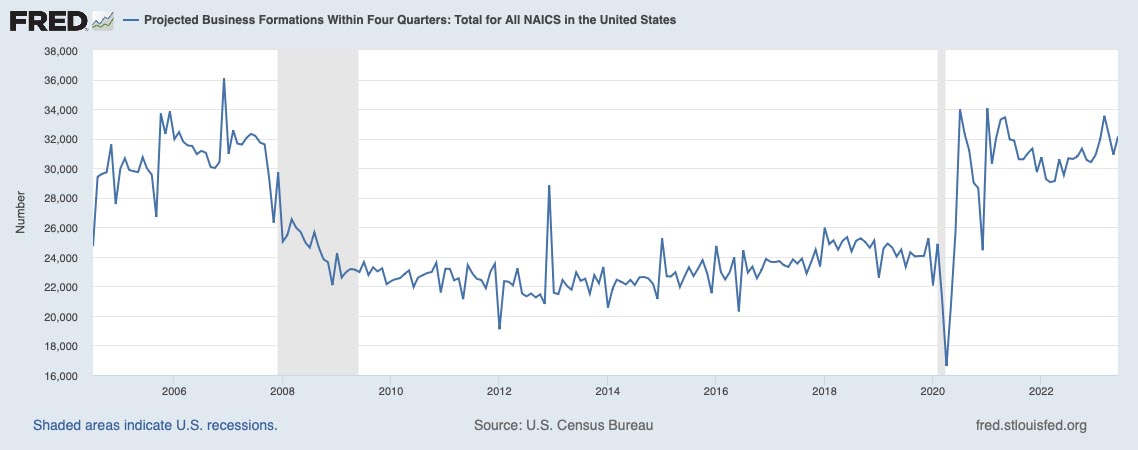
The 2008 Great Recession really did a number on entrepreneurship. (We’re also not sure what was going on in 2013.)
Here’s why this is important for printers. New businesses need a lot of resources and other materials to get started, much of it involving print of some kind (like marketing collateral, etc.), and often including signage and other kinds of display graphics. This presents ample opportunities for print providers.
The Census Bureau also breaks these down by specific NAICS categories and the top sector for new business creation is “retail trade,” followed by “administrative and support.” As we always advise, a check of your local or regional new business registrations would be a good place to start to mine these opportunities.


