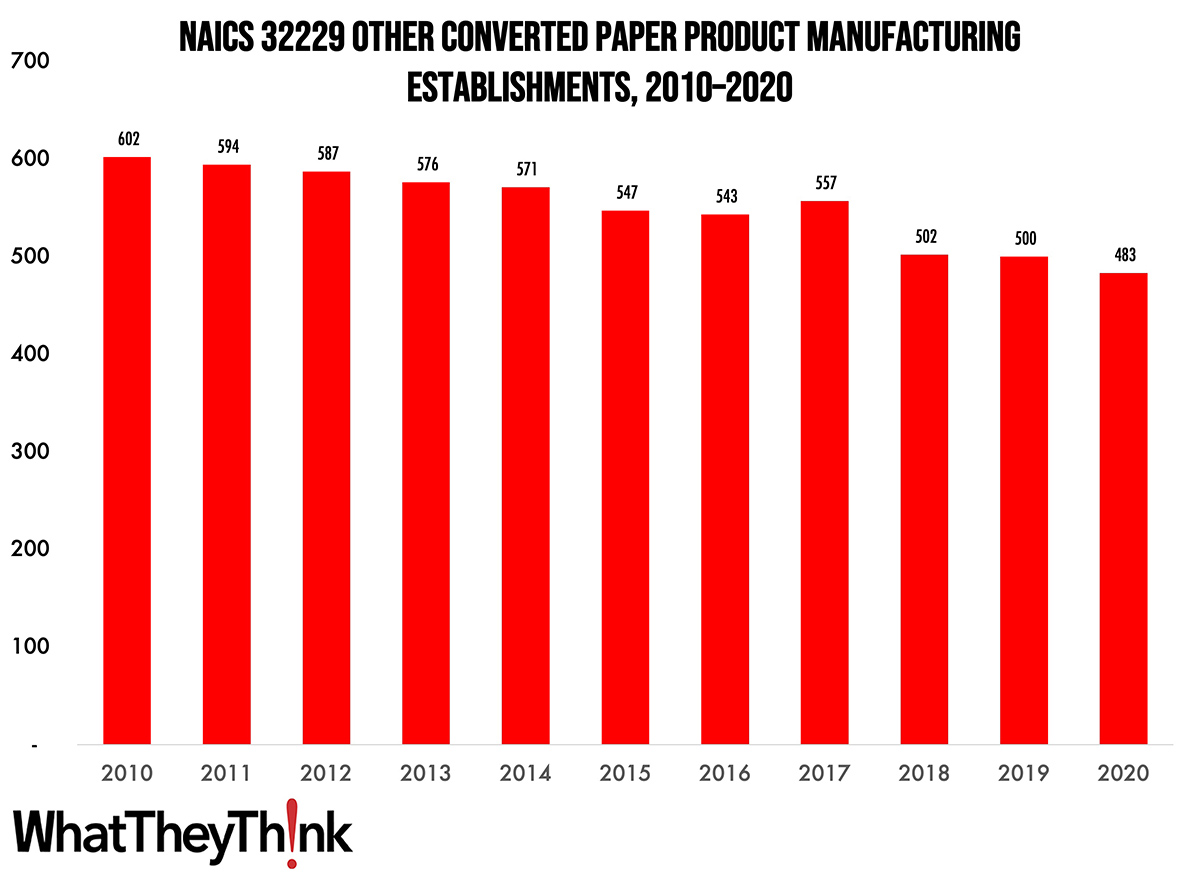
According to County Business Patterns, in 2010, there were 483 establishments in NAICS 32229 (Other Converted Paper Product Manufacturing). This NAICS category has declined steadily over the course of the decade.
The Bureau of the Census definition for this business classification:
This industry comprises establishments primarily engaged in (1) converting paper and paperboard into products (except containers, bags, coated and treated paper and paperboard, and stationery products) or (2) converting pulp into pulp products, such as disposable diapers, or molded pulp egg cartons, food trays, and dishes. Processes used include laminating or lining purchased paper or paperboard.
Since this product category largely comprises food trays, egg cartons, and a similar hodgepodge of food packaging-related products, trends in this packaging category will depend upon trends in the types of food they contain. For example, starting in 2018, egg consumption had been increasing and creative egg packaging was seen as an “uncracked market,” according to the American Egg Board (waka waka). Competition from foam-based food trays and cartons was and continues to be substantial, and while cushioning, cost-effectiveness, and moisture-impermeability work in foam’s favor, biodegradability/sustainability works in the favor of paper-based trays/cartons. At the time, there was also increased demand for food trays/packaging (take-out, restaurant leftovers, school and cafeteria use, etc., e.g.), but had been moving in foam’s direction. (There was of course a spike in home delivery/take-out during the lockdowns of 2020, so it will be interesting to see what this data series looks like in a couple of years.) At the same time, the increasing number of municipal bans on foam takeout containers can work to paper’s advantage.
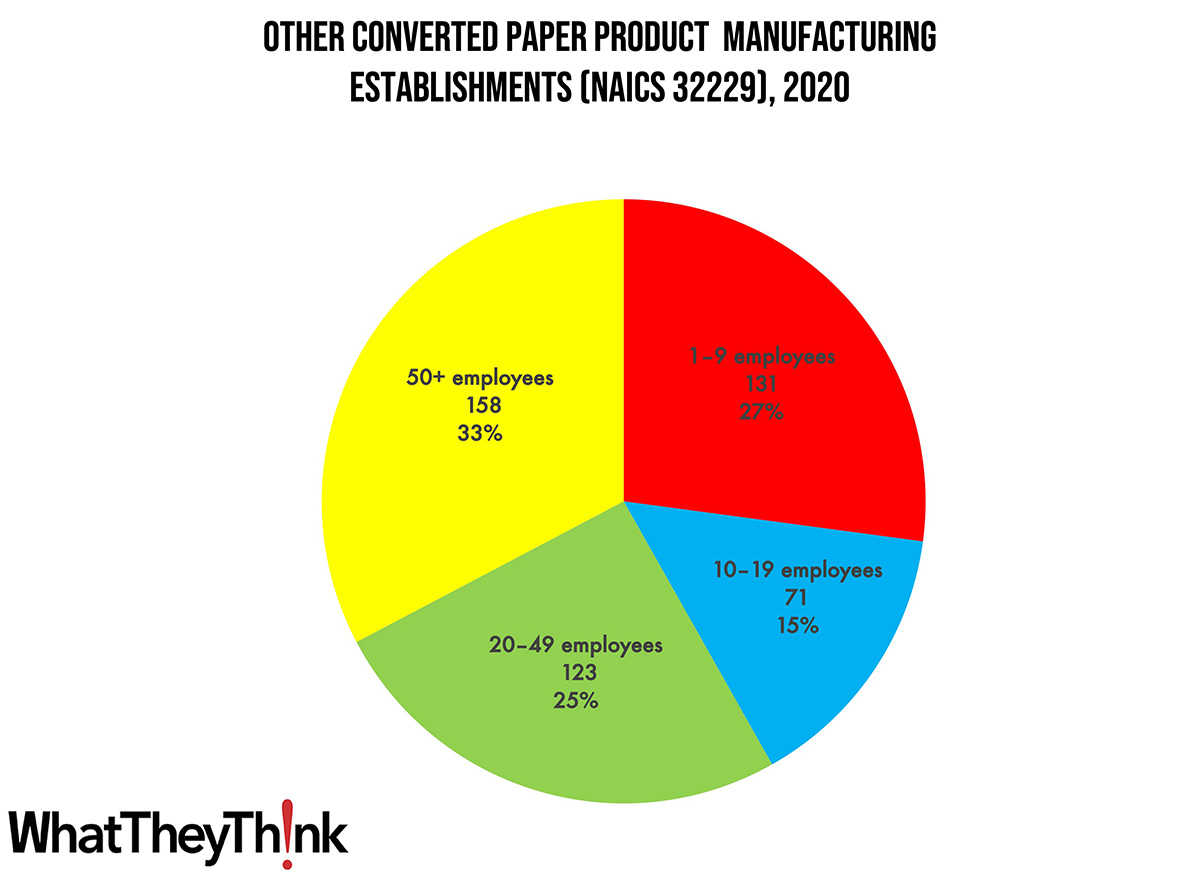
Establishments in this category are pretty evenly distributed. Small converted paper manufacturers (1 to 9 employees) account for 27% of all establishments, large manufacturers (50+ employees) account for 33% of establishments, and mid-size establishments (10–49 employees) account for 40%.
These counts are based on data from the Census Bureau’s County Business Patterns. Every other week, we update these data series with the latest figures. These counts are broken down by printing business classification (based on NAICS, the North American Industrial Classification System).
Next up, we’ll continue through the converting NAICS categories:
- 322291 Sanitary Paper Product Manufacturing
- 322299 All Other Converted Paper Product Manufacturing
To clarify what is included in the 2020 CBP, establishment counts represent the number of locations with paid employees at any time during the year. If an establishment existed at any point during the year, it would be included in the CBP count of the number of establishments for 2020 CBP. Thus, businesses lost during the COVID pandemic won’t be accounted for until the 2021 CBP.
That said, 2021 County Business Patterns has just been released! After we finish the last two 322 categories, we are going to circle back to 323 and see what the pandemic hath wrought.
These data, and the overarching year-to-year trends, like other demographic data, can be used not only for business planning and forecasting, but also sales and marketing resource allocation.
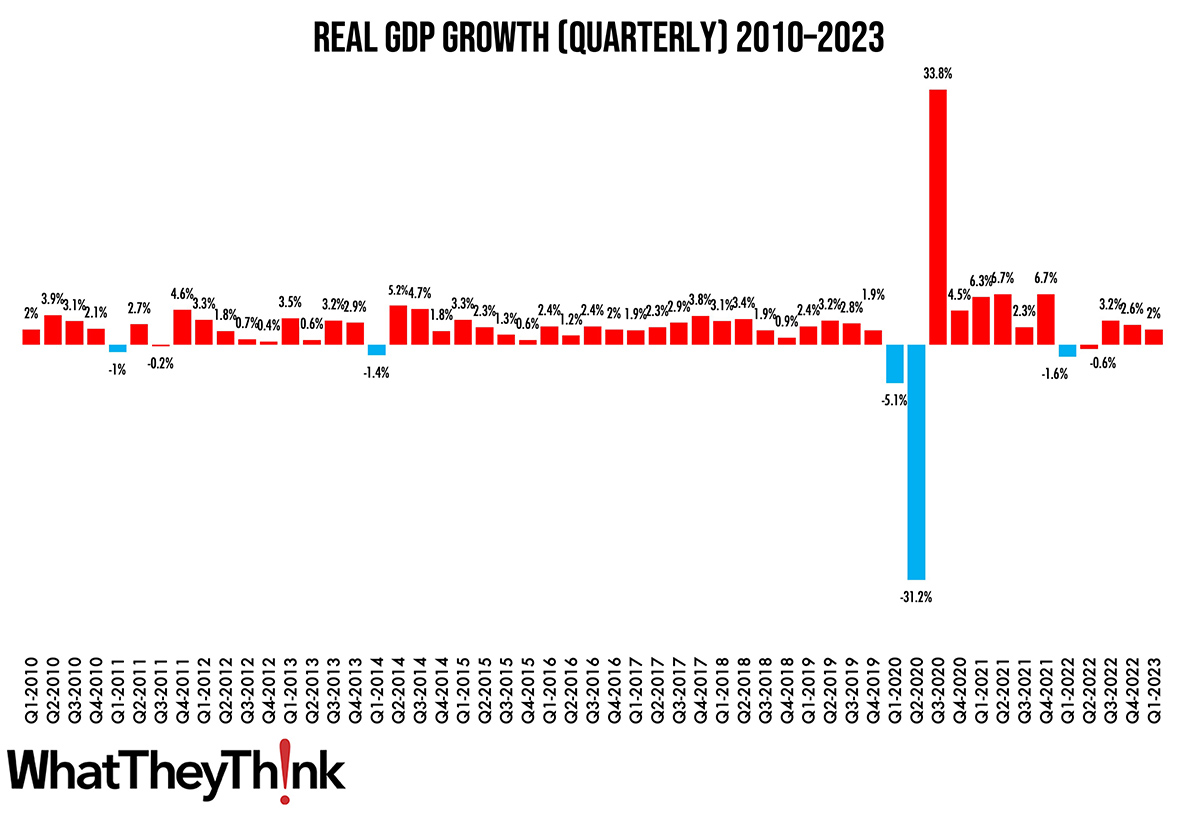
This Macro Moment…
Yesterday, the Bureau of Economic Analysis released its revised estimate of Q1 2023 gross domestic product (GDP):
Real gross domestic product (GDP) increased at an annual rate of 2.0 percent in the first quarter of 2023 (table 1), according to the “third” estimate released by the Bureau of Economic Analysis. In the fourth quarter, real GDP increased 2.6 percent.
The GDP estimate released today is based on more complete source data than were available for the “second” estimate issued last month. In the second estimate, the increase in real GDP was 1.3 percent. The updated estimates primarily reflected upward revisions to exports and consumer spending that were partly offset by downward revisions to nonresidential fixed investment and federal government spending. Imports, which are a subtraction in the calculation of GDP, were revised down.
The increase was due to increases in consumer spending, exports, government spending (local, state, and federal), and nonresidential fixed investment. These increases were partly offset by decreases in private inventory investment and residential fixed investment. Meanwhile, imports increased.
Source: Bureau of Economic Analysis
So, with GDP still growing, inflation waning (but, yes, still fairly high) and unemployment still near record lows, we’re heading into the summer in pretty good economic shape. Still no signs of a recession, so there is little reason—at least macroeconomically—for printers or print buyers to hunker down and cut spending.


