The latest edition of County Business Patterns was recently released, which includes 2020 data. (CBP 2020 data reflects the number of establishments as of March—so these counts are pre-COVID.)
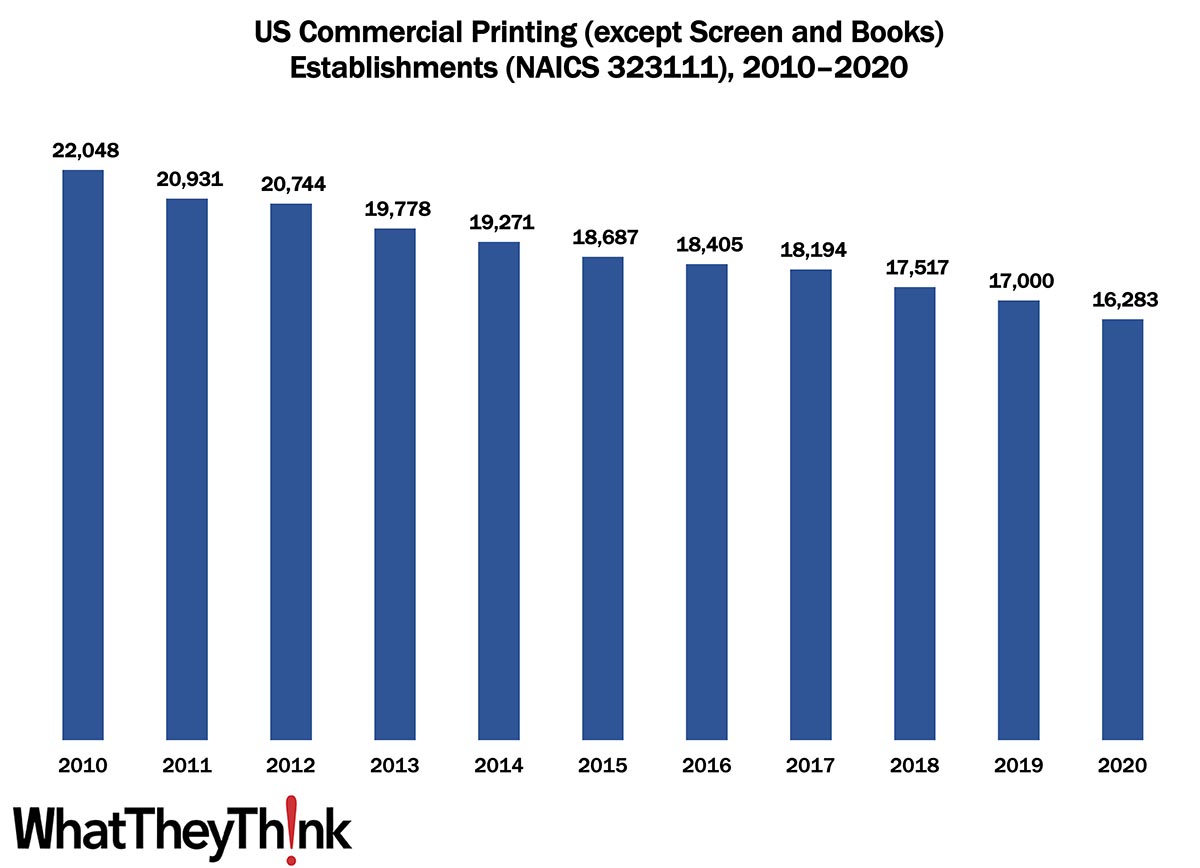
As 2020 began, there were 16,283 establishments in NAICS 323111 (Commercial Printing except Screen and Books). This represents a decline of 26% since 2010. The biggest declines were in the early years of the decade (but see statistical note below), thanks to the Great Recession, with establishments dropping 5% from 2010 to 2011. Things stabilized by mid-decade, but consolidation picked up toward the end of the decade, with establishments declining 7% from 2018 to 2020.
A statistical note. In the 2012 Economic Census, the Census Bureau overhauled the three-digit NAICS 323 and rolled up a number of sub-categories. In 2010 and 2011 (that is, prior to 2012), the categories in NAICS 323 were:
- 323 Printing and related support activities
- 32311 Printing
- 323110 Commercial lithographic printing
- 323111 Commercial gravure printing
- 323112 Commercial flexographic printing
- 323113 Commercial screen printing
- 323114 Quick printing
- 323115 Digital printing
- 323116 Manifold business forms printing
- 323117 Books printing
- 323118 Blankbook, looseleaf binders, and devices manufacturing
- 323119 Other commercial printing
- 32312 Support activities for printing
- 323121 Tradebinding and related work
- 323122 Prepress services
Following the 2012 Economic Census, NAICS 323 was whittled down to:
- 323 Printing and Related Support Activities
- 32311 Printing
- 323111 Commercial Printing (except Screen and Books)
- 323113 Commercial Screen Printing
- 323117 Books Printing
- 32312 Support Activities for Printing
Many of those sub-NAICS categories were combined into 323111. To arrive at the 2010 and 2011 numbers in the chart above, we combined establishments for NAICS 323110, 323111, 323112, 323114, 323115, 323116, 323118, and 323119 to arrive at establishments for new NAICS 323111. Note that screen and book printing were left to their own NAICS categories.
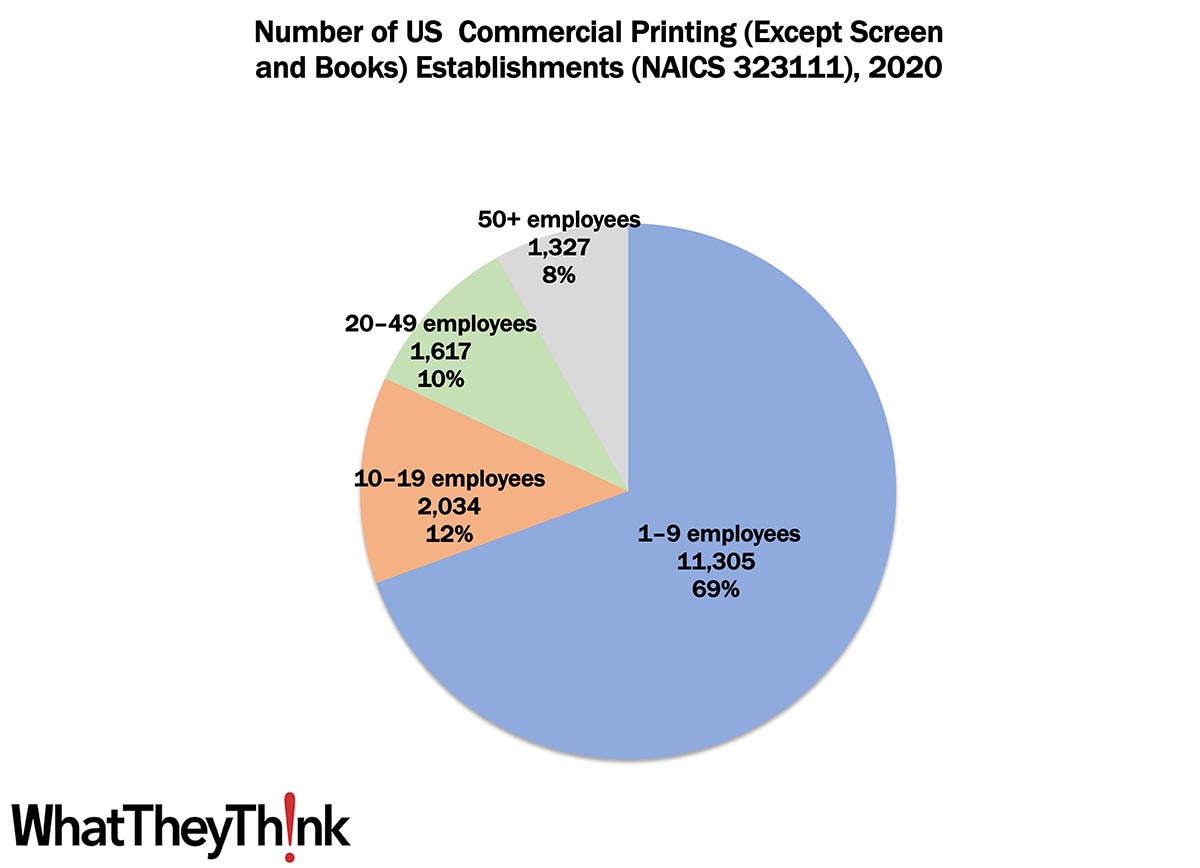
Small shops (1 to 9 employees) still comprise the bulk of the industry, accounting for 69% of all establishments. The largest shops account for only 8% of industry establishments with mid-size shops accounting for about one-fourth of establishments. These percentages have not varied substantially since at least as far back as 2010.
These counts are based on data from the Census Bureau’s County Business Patterns. Throughout this year, we will be updating these data series with the latest CBP figures. County Business Patterns includes other data, such as number of employees, payroll, etc. These counts are broken down by commercial printing business classification (based on NAICS, the North American Industrial Classification System):
- 323113 (Commercial Screen Printing)
- 323117 (Books Printing)
- 32312 (Support Activities for Printing—aka prepress and postpress services)
These data, and the overarching year-to-year trends, like other demographic data, can be used not only for business planning and forecasting, but also sales and marketing resource allocation.
This Macro Moment…
Said the Bureau of Labor Statistics on Wednesday:
The Consumer Price Index for All Urban Consumers (CPI-U) was unchanged in July on a seasonally adjusted basis after rising 1.3 percent in June, the U.S. Bureau of Labor Statistics reported today. Over the last 12 months, the all items index increased 8.5 percent before seasonal adjustment.
The gasoline index fell 7.7 percent in July and offset increases in the food and shelter indexes, resulting in the all items index being unchanged over the month. The energy index fell 4.6 percent over the month as the indexes for gasoline and natural gas declined, but the index for electricity increased. The food index continued to rise, increasing 1.1 percent over the month as the food at home index rose 1.3 percent.
The index for all items less food and energy rose 0.3 percent in July, a smaller increase than in April, May, or June. The indexes for shelter, medical care, motor vehicle insurance, household furnishings and operations, new vehicles, and recreation were among those that increased over the month. There were some indexes that declined in July, including those for airline fares, used cars and trucks, communication, and apparel.
The all items index increased 8.5 percent for the 12 months ending July, a smaller figure than the 9.1-percent increase for the period ending June. The all items less food and energy index rose 5.9 percent over the last 12 months. The energy index increased 32.9 percent for the 12 months ending July, a smaller increase than the 41.6-percent increase for the period ending June. The food index increased 10.9 percent over the last year, the largest 12-month increase since the period ending May 1979.
You likely have noticed that gas prices have been steadily declining for the past few weeks (yesterday’s New York Times had the headline, “Gas Prices in the U.S. Fall Below $4 a Gallon”). Perhaps the most conspicuous lingering inflationary category is food (up 10.9% over the last year).
One month does not a trend make, of course, but given the current state of the economy as a whole (very good), it would not be out of line to see some light at the end of the inflationary tunnel. And, yes, a 0% change in inflation at this point is still fairly high inflation, it still suggests we may be close to being out of the woods (or tunnel—choose your metaphor).
And then, yesterday, the BLS announced that the Producer Price Index (PPI) plummeted in July.
The Producer Price Index for final demand fell 0.5 percent in July, seasonally adjusted, the U.S. Bureau of Labor Statistics reported today. This decline followed advances of 1.0 percent in June and 0.8 percent in May. (See table A.) On an unadjusted basis, final demand prices moved up 9.8 percent for the 12 months ended in July.
At the same time, core PPI (sans food and energy) rose 0.2% from June and 7.6% from a year earlier. Said Bloomberg:
The figures suggest some pipeline inflationary pressures are beginning to ease, which could ultimately temper the pace of consumer price growth in coming months. Commodity prices, including oil, have dropped sharply in recent months, and there are indications that supply-chain conditions are improving.
Here’s hoping.


