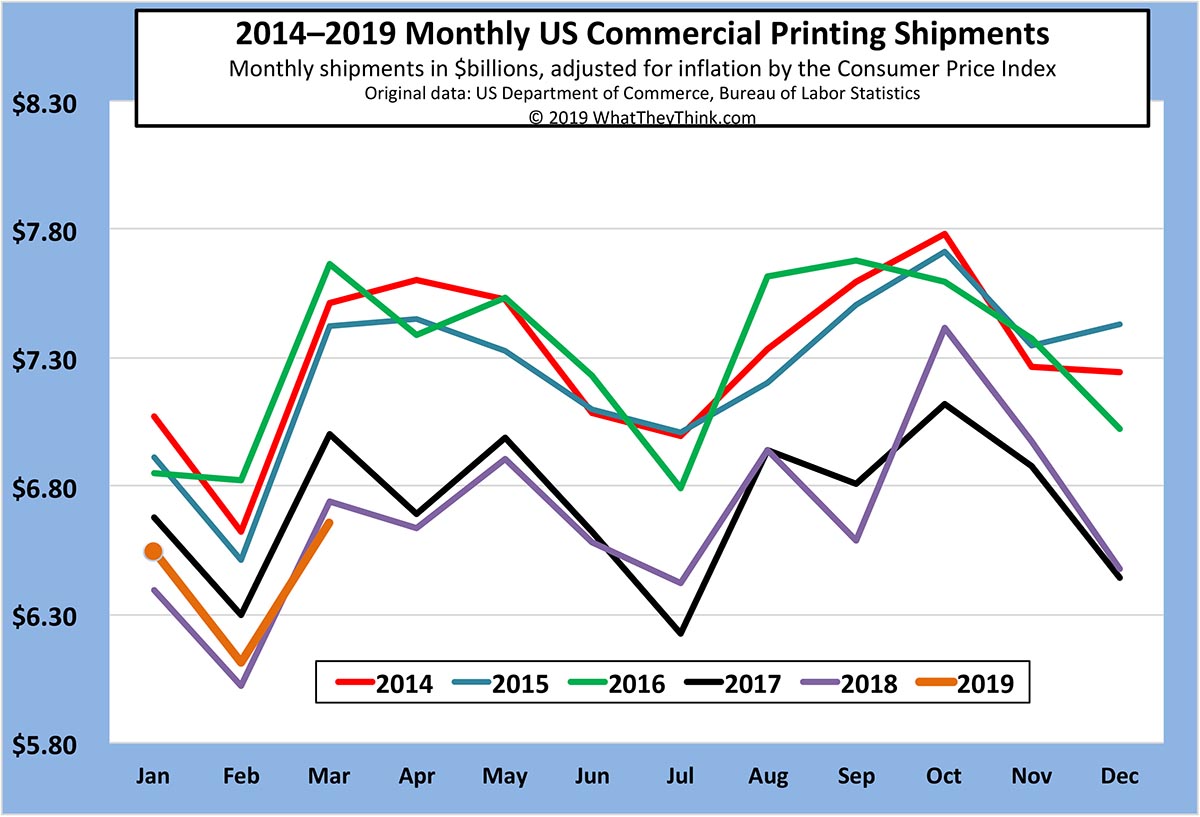
The value of printing shipments for March were—as we would expect, given the new print seasonality—up from February. However, disappointingly, at $6.66 billion, March 2019 shipments came in below March 2018’s $6.74 billion. Not a huge difference, but we were hoping for a better month. On the plus side, year-to-date shipments for 2019 are ahead of 2018—January-to-March shipments for 2019 are at $19.31 billion compared to 2018’s $19.16, thanks to two good months to kick off this year. We’re expecting April shipments to drop, but can they at least remain above 2018’s level—or, even better, 2017’s level?
Granted, cheering on monthly shipments to exceed the previous year can be a bit horse-racey (for maximum security, we shouldn’t wager money on it, as it were...), but we have been encouraged that shipments for last year came pretty darn close to exceeding shipments for the previous year—which is not something we have seen in a long time. Once that happens, we’ll truly know that the industry has turned a corner.
Still, we do have to caution that NAICS 323 (which is what these shipments data are based on) isn’t necessarily the sole printing-related three-digit NAICS anymore. Some shops are classifying themselves in different kinds of services NAICS, and wide-format and sign manufacturers have their own NAICS classifications. Ironically, as the different parts of the industry converge, they are diverging from NAICS 323, which makes tracking industry statistics that much more of a challenge, and can make the industry seem much gloomier than it really is. (But then it could be argued that the industry should be diverging...)
Housekeeping note: The Census Bureau will be making significant revisions to past and present shipments data today, after "press" time. Once we have dug into them, and subsequently sobered up, we will highlight the relevant revisions.


