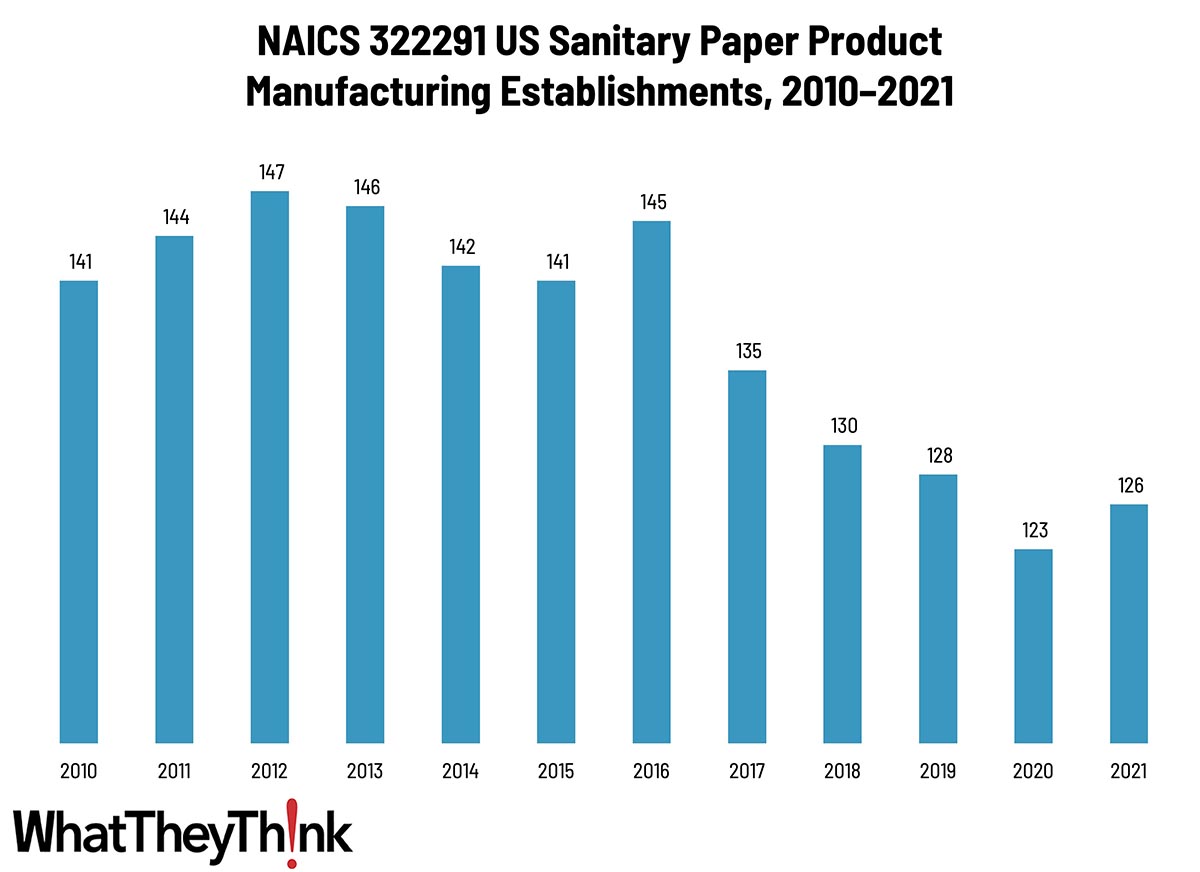
According to County Business Patterns, in 2010, there were 123 establishments in NAICS 322291 (Sanitary Paper Product Manufacturing). This NAICS category has declined steadily over the course of the decade.
The Bureau of the Census definition for this business classification:
This U.S. industry comprises establishments primarily engaged in converting purchased sanitary paper stock or wadding into sanitary paper products, such as facial tissues, handkerchiefs, table napkins, toilet paper, towels, disposable diapers, sanitary napkins, and tampons.
Although the sanitary paper product market is a mature one, with few truly new products coming to market and few avenues for growth, it’s still not one to sneeze at. The market is dominated by a few very large manufacturers with little room for newcomers—and the establishment data reflect no small amount of consolidation.
Products are broadly divided into “consumer” and “commercial and industrial,” the latter of which is intended for schools, hospitals, or offices. Although the distinction is rarely important, in 2020, the inability of manufacturers to quickly pivot from the latter to the former led to the infamous toilet paper shortages during the pandemic lockdown.
These products tend to be “non-discretionary,” in that there is very little that will stimulate (or depress) usage/sales, save for a particularly bad cold/flu/allergy season (or a pandemic), perhaps. The adult incontinence product category is perhaps the most recent new product category, and this market depends on population demographics, which currently favor growth. A baby boom would favor growth at the other end of the incontinence spectrum. The industry also tends to be highly integrated, so the major companies that manufacture the raw materials also convert those into the final products.
Interestingly, small changes in these categories can have substantial environmental impacts—and sometimes for the better. UK supermarket chain Sainsbury reduced the width of a toilet paper roll by 11mm, allowing more rolls to be fit into a delivery van and eliminating 500 van trips a year—saving 140 tons of CO2 annually in reduced transport and materials.
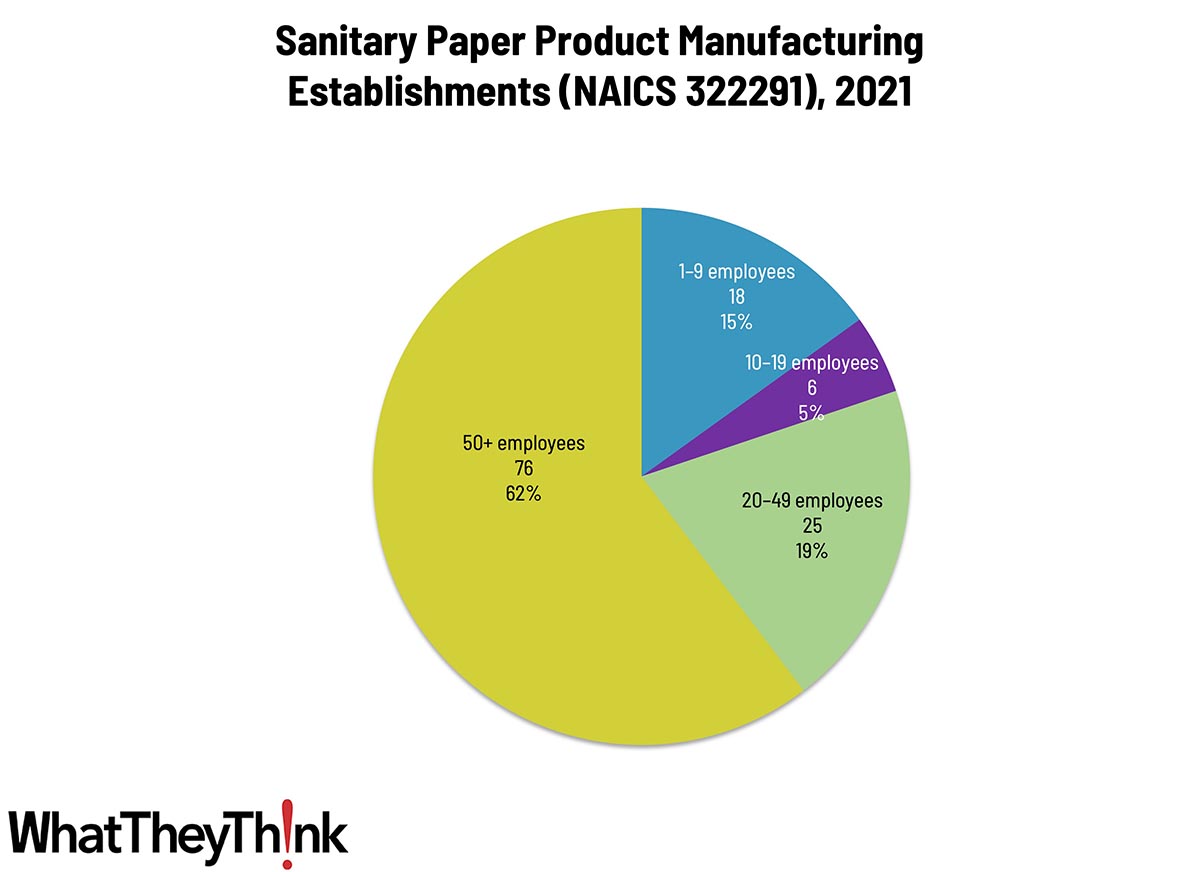
Establishments in this category are fairly concentrated at the large end. Small stationery product manufacturers (1 to 9 employees) account for 15% of all establishments, large manufacturers (50+ employees) account for 62% of establishments, and mid-size establishments (10–49 employees) account for 24%.
These counts are based on data from the Census Bureau’s County Business Patterns. Every other week, we update these data series with the latest figures. These counts are broken down by printing business classification (based on NAICS, the North American Industrial Classification System).
Next up, the last of the converting categories:
- 322299 All Other Converted Paper Product Manufacturing
To clarify what is included in the 2021 CBP, establishment counts represent the number of locations with paid employees at any time during the year. If an establishment existed at any point during the year, it would be included in the CBP count of the number of establishments for 2021 CBP. Thus, businesses lost (or gained) during the COVID pandemic are accounted for in this series.
These data, and the overarching year-to-year trends, like other demographic data, can be used not only for business planning and forecasting, but also sales and marketing resource allocation.
This Macro Moment…
Last week, the American Institute of Architects (AIA) released its Architecture Billings Index (ABI) for July. The ABI is a leading indicator for new commercial real estate investment—and thus potential new signage projects. It has been a sluggish year for architecture firms, but things are looking to rebound. The ABI for June was 46.4 (any score below 50 indicates declining billings), but July’s had increased to 48.2, indicating that fewer firms reported a decline in billings. But, says the AIA:
it still means that more than half of responding firms this month are still experiencing soft business conditions. As far as future work in the pipeline at firms, the value of newly signed design contracts decreased for the fourth consecutive month in July, but the pace of that decline slowed as well. In addition, inquiries into new projects continued to increase this month, although that growth continued at the same slow pace they have been growing at for much of the year so far.
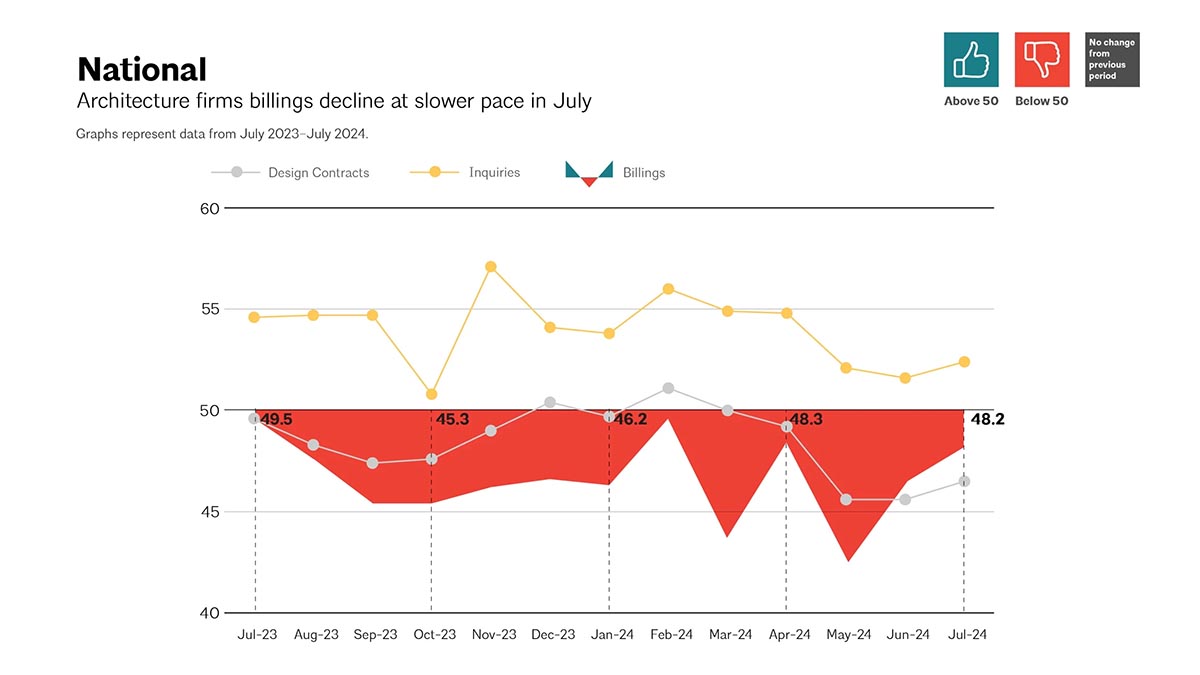
Source: AIA
July marks the 18th consecutive month that architecture firms’ billings have declined.
The rule of thumb is that this index leads actual commercial real estate investment by about 9–12 months. We occasionally look at the ABI as commercial construction impacts potential new signage projects as well as the AEC market.