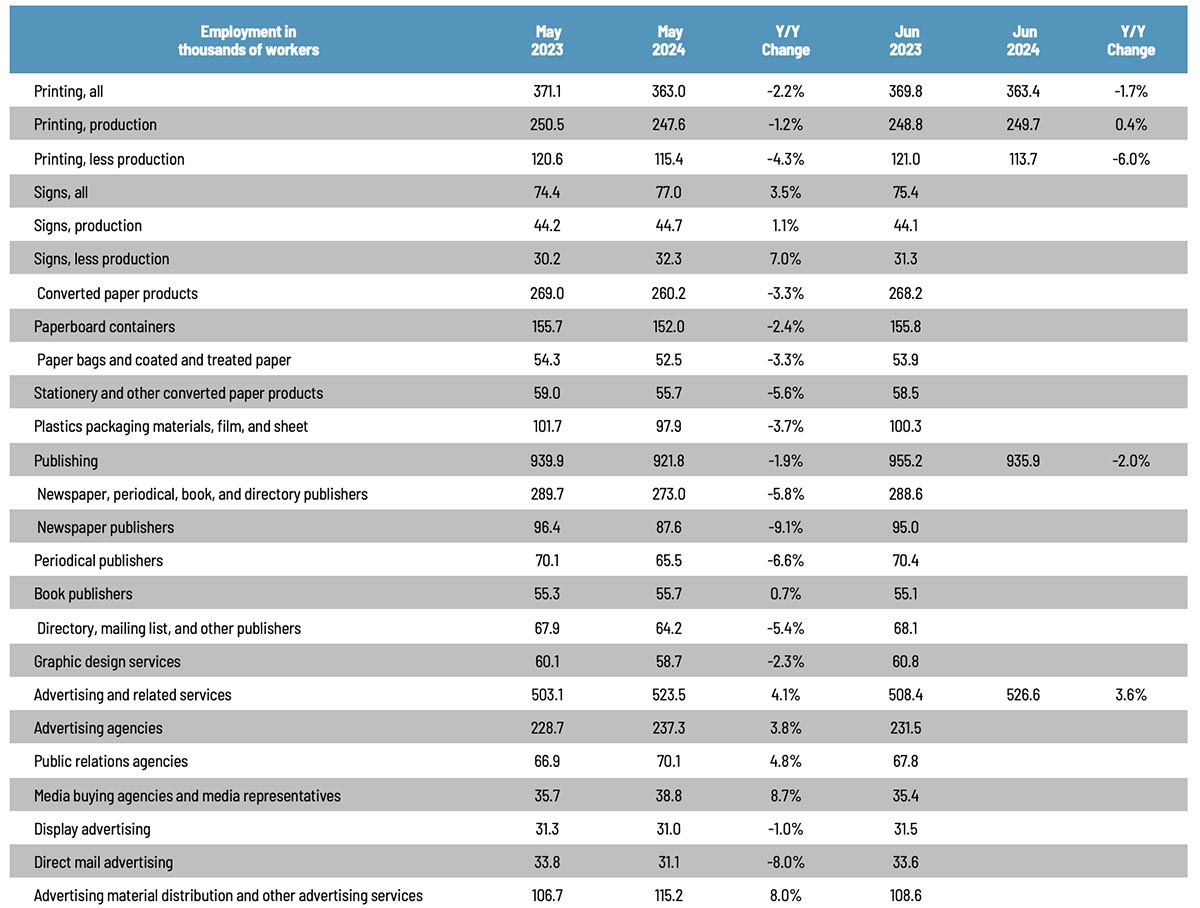
We haven’t looked at industry employment in a while, but as we headed into summer, overall printing employment in June 2024 was up ever so slightly from May, but in terms of production vs. non-production, not unlike what we saw back in April. Overall printing employment was up 0.1% in general, with production employment up 0.8% and non-production employment down 1.5%.
In terms of publishing, overall publishing employment was up 1.5% from May to June, while advertising and related services was up 0.6%.
Last year, we started adding a number of other business categories to our employment table, the reporting of which, as you may recall from our tracking of the publishing and creative markets, lags a month.
Overall employment in the signage industry was up 1.2% from April to May, with sign production employment up 0.4% and non-production up a strong 2.2%.
Converted paper products employment was down 0.9% from April to May, with paperboard container employment down 0.5% and paper bags and coated and treated paper employment unchanged.
Looking at some specific publishing and creative segments, from April to May, periodical publishing employment was down 1.7%, while newspaper publishing employment was down 0.6%, and book publishing was up 1.1%. Graphic design employment took a tumble, down 3.0% from April to May, ad agency employment was down 0.5%, and PR agencies won the month (with sign non-production) with employment up 2.2%. Direct mail advertising employment was up 0.6%.
As for June employment in general, the BLS reported on July 5 that total nonfarm payroll employment increased by 206,000 in June, and the unemployment rate changed little at 4.1%. Job gains occurred in government, health care, social assistance, and construction.
Meanwhile, the change in total nonfarm payroll employment for April was revised down by 57,000, and the change for May was revised down by 54,000. Ergo, employment in April and May combined is 111,000 lower than previously reported. So it goes.
The U-6 rate (the so-called “real” unemployment rate which includes not just those currently unemployed but also those who are underemployed, marginally attached to the workforce, and have given up looking for work) was unchanged at 7.4%.
The labor force participation rate increased from 62.5% in May to 62.6% in June, and the employment-to-population ratio was unchanged at 60.1%. The labor force participation rate for 24–54-year-olds ticked up from 83.6% to 83.7%—the highest level since 2001.
This report was actually above economists’ expectations, although the downward revisions to April and May are a bummer.
The July employment report comes out later today and it may have an added resonance. We have likely at some point referred here to something called the “Sahm Rule,” named after Claudia Sahm, a former Federal Reserve economist and now an independent consultant. Although not designed as a recession predictor per se, it has become a rather reliable one. Basically the rule is this: if the average unemployment rate over the past three months has risen 0.5 percentage point from its most recent low, then a recession is probably afoot. Now, if you keep track of these things, you may have noticed that the unemployment rate has been creeping up. In April 2023, the unemployment rate hit a record low of 3.4%. It is possible that today’s report may trigger the Sahm Rule. As Sahm explained last week:
The gradual pace of the current rise in the unemployment rate is not unusual, but some underlying drivers are making the current reading of the Sahm rule look overly ominous. The Sahm rule was 0.43 in June 2024, close to the historical trigger of 0.50 in past recessions. One more increase in the unemployment rate in July to 4.2% would trigger the rule, suggesting that we are in the early months of a recession.
However, if we were witnessing the onset of a recession, certainly other economic indicators like GDP, consumer spending, personal income, and payroll employment wouldn’t still be growing, as they in fact have been. Sure, Sahm likes to use the unemployment rate because it’s monthly (and a three-month average to filter out any noise), but surely we would have seen evidence elsewhere. And we haven’t.
What is the Sahm rule using the unemployment rate missing now? Dramatic shifts in the labor force, including the plunge in participation early in the pandemic and then the jump in immigration in recent years, are likely affecting the change in the unemployment rate in a way that would not be typical in prior business cycles.
The Sahm rule uses the change in the unemployment rate to identify a recession. At the same time, there are changes ‘under the hood’ in the composition of the unemployed that are similar across recessions. However, the recent shift in the composition is not typical for a recession or, at least, not for an imminent recession.
Remember, the US economy is a complex organism—especially post-pandemic—and it’s difficult to capture all its dynamics in a single number. We’re tempted to make a Douglas Adams reference here, but, ultimately:
The Sahm rule is currently sending the right cautionary message about the labor market cooling, but the volume is too loud. The swing from labor shortages caused by the pandemic to a burst in immigration is magnifying the increase in the unemployment rate. At the same time, the demand for workers is softening. A recession is not imminent, but the risks of a recession have risen.
So we can be cautiously optimistic.