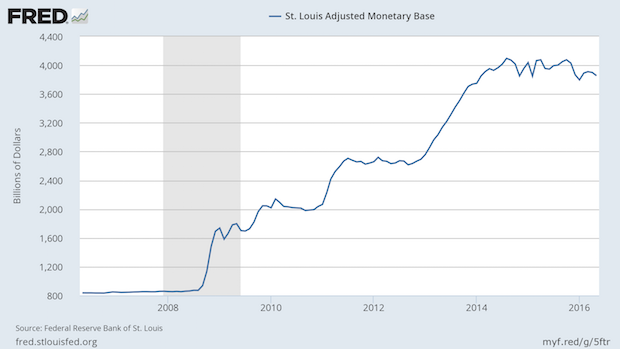
This chart shows the Fed's balance sheet in the format known as the St. Louis Adjusted Monetary Base. Prior to the doubling of that balance sheet, it was growing at the annual rate of 6%, which was basically comprised of the long term rates of 1% for population growth, 2% for inflation, and 3% for economic growth.
When the housing bubble hit, the commodities collapse, and the economic slowdown, the Fed got aggressive. The three periods of quantitative easing (QE) are seen as steps in the chart. QE1 at about the 2010 area of the chart, QE2, at about 2012 position, and QE3 at around 2015.
The QE effort has not ended. As Fed holdings of bonds and other obligations have matured, they have replaced them with other instruments, and are not attempting to return to prior levels. Is QE4 in the offing? That's been my bet for some time, and the combination of slow world economies, reaction to Brexit, concerns about China, and exchange rate levels that many central banks consider unreasonable, the only option for the Fed is to engage in more purchases. Bond investor Bill Gross, formerly of Pimco and now of Janus, has suggested that the Fed take a lesson from the board game Monopoly. Negative interest rates do not allow for compounding, critical for savings and investment, forcing savers to seek more risk. This worries Gross, and others, greatly.
We may get QE4, whether it's right or not. It might be that the most important thing you can do at the Fed is to look busy.