The latest edition of County Business Patterns was just released, which includes 2022 data.
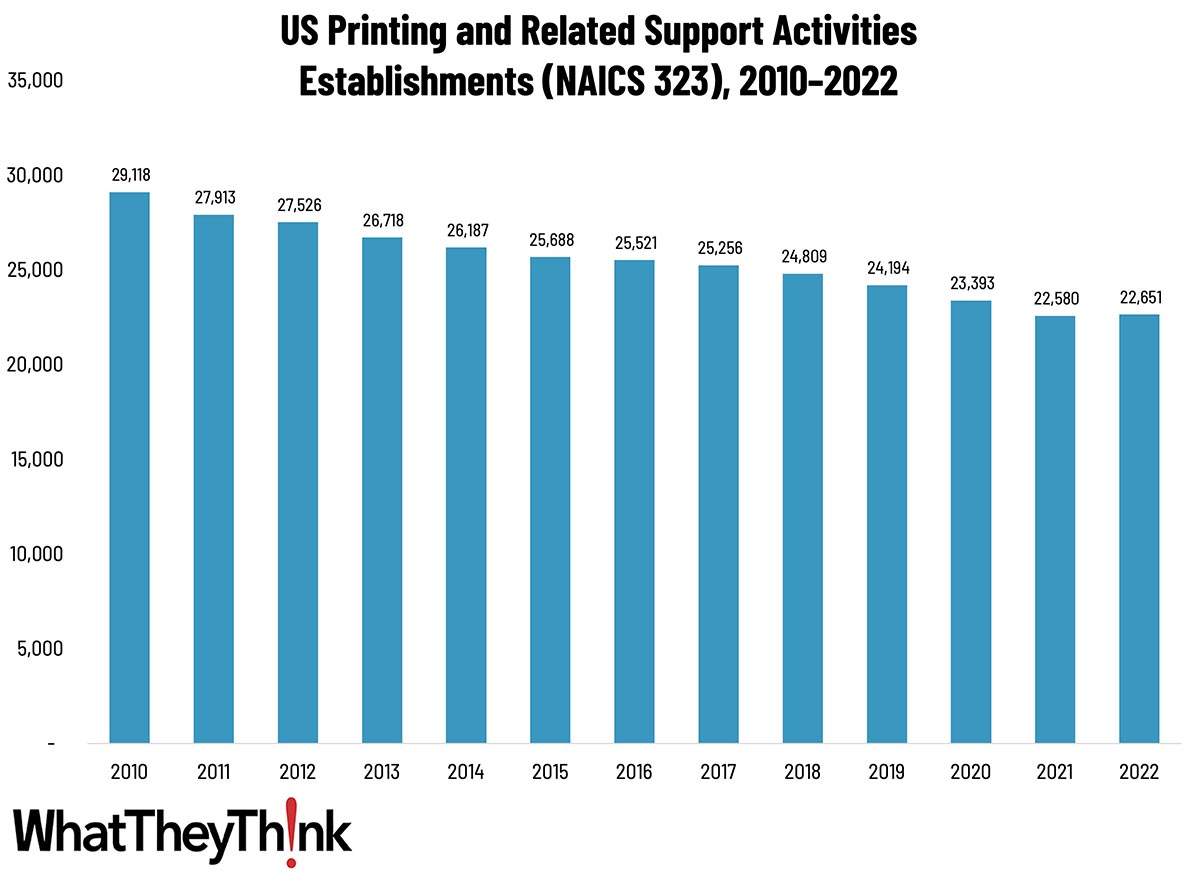
As 2022 began, there were 22,651 establishments in NAICS 323 (Printing and Related Support Activities). While this represents a decline of 22% since 2010—and a 6% drop from 2019—we did see an increase of 71 establishments from 2021. From 2010 to 2011, establishments declined by 4%, thanks to the Great Recession, and from 2014 to 2015, the decline was only 2%; and from 2016 to 2017, the decline was 1%. Consolidation picked up toward the end of the decade, with establishments declining 6% from 2018 to 2020. And then the pandemic hit, although the impact was not as bad as we had been expecting. As we remarked in our Printing Outlook 2023 report, based on our Fall 2022 survey, 2022 was the “back in the black” year for the industry, with print buyers racing to replenish the printed materials they had cut back on during the pandemic year(s). It is not surprising that an increase in demand saw an increase in printing establishments.
If we look at the specific employee size categories, every size category except 1–4-employee shops saw an increase in establishments. At the high end, consolidation would account for a chunk of this (consolidation alone would not result in an overall net increase of establishments), but for the mid-size shops, we see these as new businesses. Now, mind you, the increase is not huge, and knowing what we know about 2023 and 2024, we might see these numbers tick down again. But it’s nice to know that if we increase the demand for print, we will see a growing industry.
The way the Census Bureau captures establishment counts means that any business that existed at all in 2022 was included.
Small shops (1 to 9 employees) still comprise the bulk of the industry, accounting for 71% of all establishments. The largest shops account for only 7% of industry establishments with mid-size shops accounting for 22% of establishments. These percentages have not varied substantially since at least as far back as 2010.

These counts are based on data from the Census Bureau’s County Business Patterns. In the months ahead, we will be updating these data series with the latest CBP figures. County Business Patterns includes other data, such as number of employees, payroll, etc. These counts are broken down by commercial printing business classification (based on NAICS, the North American Industrial Classification System):
- 32311 (Printing)
- 323111 (Commercial Printing, except Screen and Books)
- 323113 (Commercial Screen Printing)
- 323117 (Books Printing)
- 32312 (Support Activities for Printing—aka prepress and postpress services)
These data, and the overarching year-to-year trends, like other demographic data, can be used not only for business planning and forecasting, but also sales and marketing resource allocation.
This Macro Moment…
According to the Bureau of Labor Statistics, in October inflation was up slightly, by 0.2%.
The Consumer Price Index for All Urban Consumers (CPI-U) increased 0.2 percent on a seasonally adjusted basis in October, the same increase as in each of the previous 3 months, the U.S. Bureau of Labor Statistics reported today. Over the last 12 months, the all items index increased 2.6 percent before seasonal adjustment.
Shelter drove more than half of the increase, rising 0.4% in October, with food increasing 0.2% (food at home increased 0.1% and food away from home rose 0.2%). The energy index was unchanged over the month, after declining 1.9 percent in September.
It was about what economists expected and compared to what we have seen in the past is a pretty small rise. Remember, though, that a slowing inflation rate does not mean that prices go down to what they were, just that things are getting more expensive less fast. And ’twas ever thus. So we should not assume that we will see prices decrease to pe-pandemic levels, just as we will never see prices decline to 1980…or 1970…or 1930 levels. (If prices do decrease drastically, that’s deflation and is a bad thing for its own reasons.)


