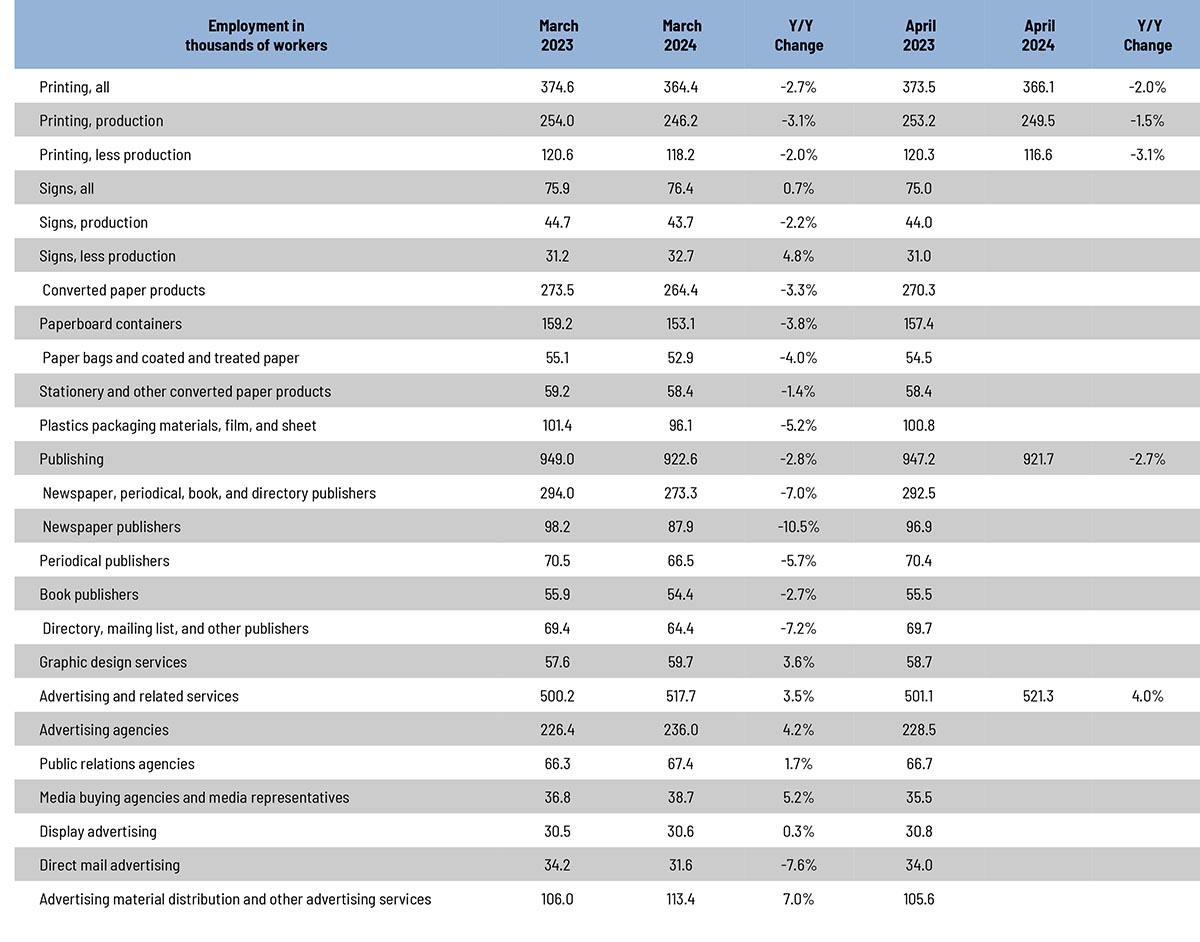
Overall printing employment in April 2024 was up ever so slightly from March, but in terms of production vs. non-production, the reverse of what we saw in March. Overall printing employment was up +0.5% in general, with production employment up +1.3% and non-production employment down -1.4%. Last month, production has been down and non-production had been up, by roughly the same amounts.
In terms of publishing, overall publishing employment was down -0.1% from March to April, while advertising and related services was up +0.7%.
Last year, we started adding a number of other business categories to our employment table, the reporting of which, as you may recall from our tracking of the publishing and creative markets, lags a month.
Overall employment in the signage industry was up +1.3% from February to March, with sign production employment up +0.9% and non-production up +1.9%.
Converted paper products employment was down -0.1% from February to March, with paperboard container employment up +0.2% and paper bags and coated and treated paper employment down -0.8%.
Looking at some specific publishing and creative segments, from February to March, periodical publishing employment was down -0.7%, while newspaper publishing employment was down -1.0%, and book publishing was up +0.4%. Graphic design employment was down -0.2% from February to March, ad agency employment was down -0.9%, and PR agencies were up +0.9%. Direct mail advertising employment was down -0.9%.
As for April employment in general, the BLS reported on May 3 that total nonfarm payroll employment increased by 175,000 in April, and the unemployment rate ticked up to 3.9%. Job gains occurred in health care, in social assistance, and in transportation and warehousing.
Meanwhile, the change in total nonfarm payroll employment for February was revised down by 34,000 (from 270,000 to 236,000) and for March was revised up by 12,000 (from 303,000 to 315,000). Ergo, employment in February and March combined was 22,000 lower than previously reported.
The U-6 rate (the so-called “real” unemployment rate which includes not just those currently unemployed but also those who are underemployed, marginally attached to the workforce, and have given up looking for work) ticked up from 7.3% to 7.4%.
The labor force participation rate was unchanged at 62.7% and the employment-to-population ratio ticked down from 60.3% to 60.2%. On the plus side, the labor force participation rate for 24–54-year-olds ticked up from 83.4% to 83.5%.
Although not a horrible employment report by any means, it was below economists’ expectations, especially given the downward revisions to February and March.