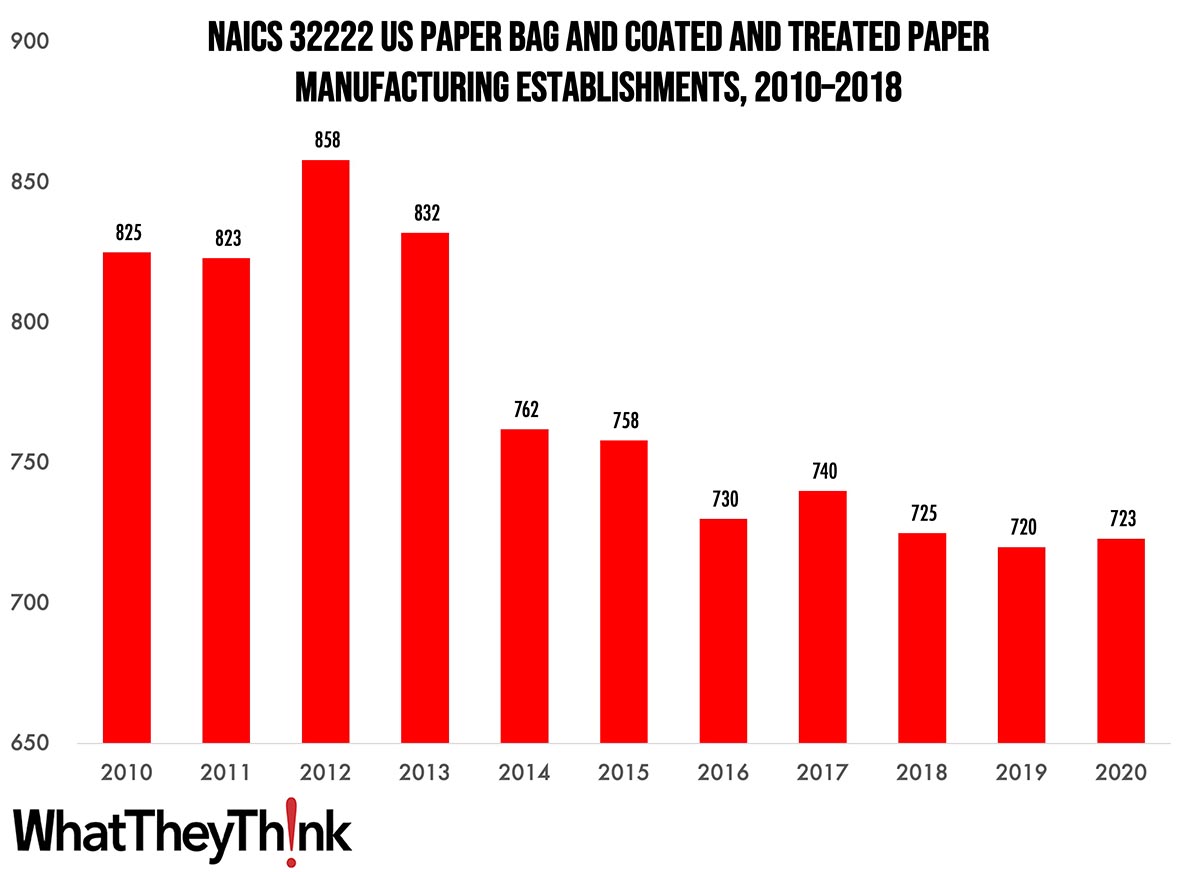
According to County Business Patterns, in 2010, there were 723 establishments in NAICS 32222 (Paper Bag and Coated and Treated Paper Manufacturing establishments). This NAICS category peaked in 2012, but has declined slowly over the rest of the decade.
The Bureau of the Census definition for this business classification:
This industry comprises establishments primarily engaged in one or more of the following: (1) cutting and coating paper and paperboard; (2) cutting and laminating paper, paperboard, and other flexible materials (except plastics film to plastics film); (3) manufacturing bags, multiwall bags, sacks of paper, metal foil, coated paper, laminates, or coated combinations of paper and foil with plastics film; (4) manufacturing laminated aluminum and other converted metal foils from purchased foils; and (5) surface coating paper or paperboard.
Towards the end of the last decade (pre-pandemic), “paper vs. plastic” considerations anecdotally worked in paper bags’ favor, as more and more municipalities had been banning or adding surcharges to plastic bags, and paper bags are easily recycled. At the same time, the growth and popularity of reusable bags have been making this conversation moot. Trends in retail can trickle down to affect bag demand, and there is still demand for niche/boutique bags. Digital printing can eliminate the “blank bag,” and laminates and other types of coatings—plastics, foils, embellishments, etc.—increase strength, aesthetic appeal, etc., but may adversely impact recyclability.
This NAICS tended to lose establishments in the under-100-employee categories, but gained establishments in the 100+-employee categories, in large part the result of consolidation. But it also reflects growing demand for products produced by establishments in this category.
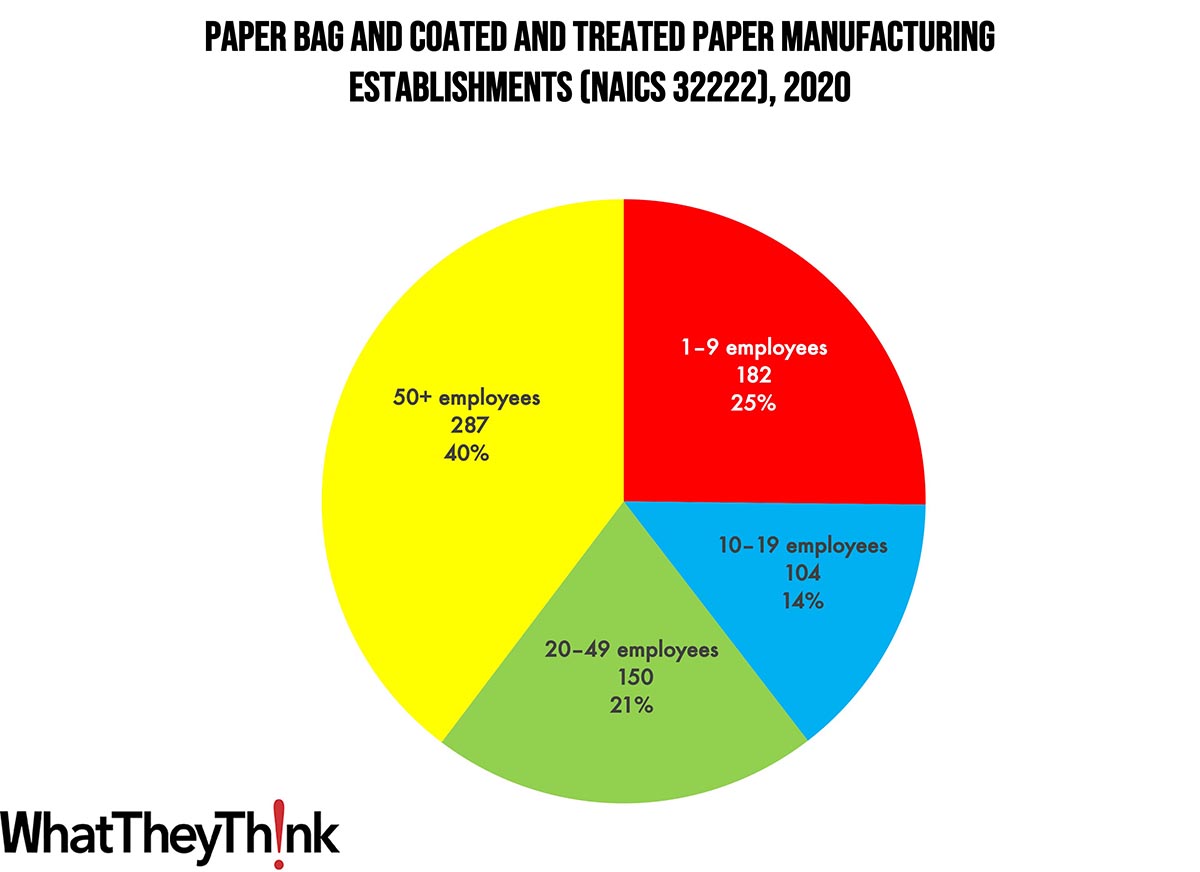
Establishments in this category are larger than we usually see in the printing and publishing industries. Small paperboard container manufacturers (1 to 9 employees) account for 25% of all establishments, while large manufacturers (50+ employees) account for 35% of establishments. Mid-size establishments account for 46%.
These counts are based on data from the Census Bureau’s County Business Patterns. Every other week, we update these data series with the latest figures. These counts are broken down by printing business classification (based on NAICS, the North American Industrial Classification System).
Next up, we’ll continue through the converting NAICS categories:
- 32223 Stationery Product Manufacturing
- 32229 Other Converted Paper Product Manufacturing
- 322291 Sanitary Paper Product Manufacturing
- 322299 All Other Converted Paper Product Manufacturing
To clarify what is included in the 2020 CBP, establishment counts represent the number of locations with paid employees at any time during the year. If an establishment existed at any point during the year, it would be included in the CBP count of the number of establishments for 2020 CBP. Thus, businesses lost during the COVID pandemic won’t be accounted for until the 2021 CBP.
These data, and the overarching year-to-year trends, like other demographic data, can be used not only for business planning and forecasting, but also sales and marketing resource allocation.
This Macro Moment…
Every now and then, we like to check in with the American Institute of Architects (AIA)/Deltek Architecture Billings Index (ABI), which is a leading indicator for new commercial real estate investment and thus potential new signage projects. According to the AIA, in April, demand for design services slumped again after rising in March for the first time since last September:
The billings score for March decreased from 50.4 in March to 48.5 in April (any score below 50 indicates a decrease in firm billings). However, firms reported that inquiries into new projects accelerated slightly to 53.9, while most firms continued to report a decline in the value of new design contracts, with a score of 49.8.
“The ongoing weakness in design activity at architecture firms reflects clients’ concerns regarding the economic outlook,” said AIA Chief Economist Kermit Baker Hon. AIA, Ph.D. “High construction costs, extended project schedules, elevated interest rates, and growing difficulty in obtaining financing are all weighing on the construction market.”
The rule of thumb is that this index leads actual commercial real estate investment by about 9–12 months.
AIA adds:
Despite the recent softness in billings, many firms are cautiously optimistic about this year. As the construction market cools, construction costs and schedules are expected to ease, which may make some projects more feasible. In addition, firms will continue to be able to capitalize on opportunities related to green building and energy efficiency initiatives that have increased over the past few years.
This impacts the potential projects for sign businesses—as well as vendors and print service providers that serve the AEC markets—who should keep an eye on construction activity in their area to get a jump on involvement in these projects.