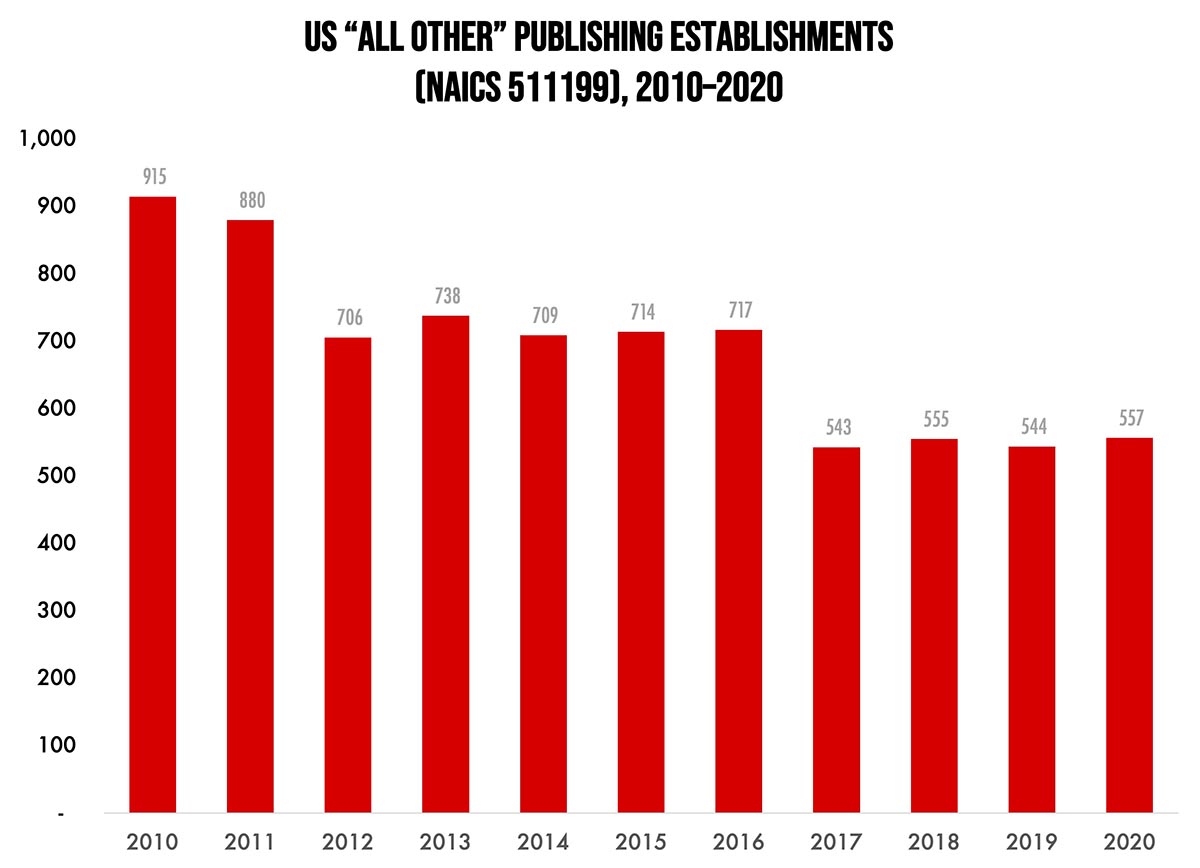
Our Friday data slice’n’dice look at the latest edition of County Business Patterns has been detailing the publishing industries. As 2020 began, there were 557 establishments in NAICS 511199 (All Other Publishing). This represents a net decrease of 39% since 2010, although we’re not talking about a tremendous number of establishments.
This is a catchall category that includes publishers who specialize in printed postcards, art prints, calendars, maps and atlases, etc. Unfortunately, a lot of these print applications have been largely replaced by digital alternatives: printed and mailed postcards have been superseded by posting pictures of trips and events on social media sites, for example. Art prints are increasingly produced digitally on inkjet equipment like Epson SureColor units, although wall and “page-a-day” calendars are still fairly strong, despite electronic calendar apps. The last time we looked at this category, we had said, “printed maps have almost entirely been replaced by GPS/GoogleMaps (except for historical or collectors maps).” And yet, as we pointed out in Around the Web last month, via Axios: “AAA produced 123% more maps in 2022 than 2021, the Wall Street Journal reports. “Digital maps, while powerful, aren’t perfect navigational tools: Phone batteries die, cell signals fail. And though a smartphone can easily direct you to the quickest route, taking it often means you’ll miss the best scenery. A paper map ... can provide a bigger picture. And it’s not just for navigation. People are buying maps as gifts or to hang on their walls as art. Artists on Etsy will hand-draw custom maps of neighborhoods with beautifully illustrated landmarks.”
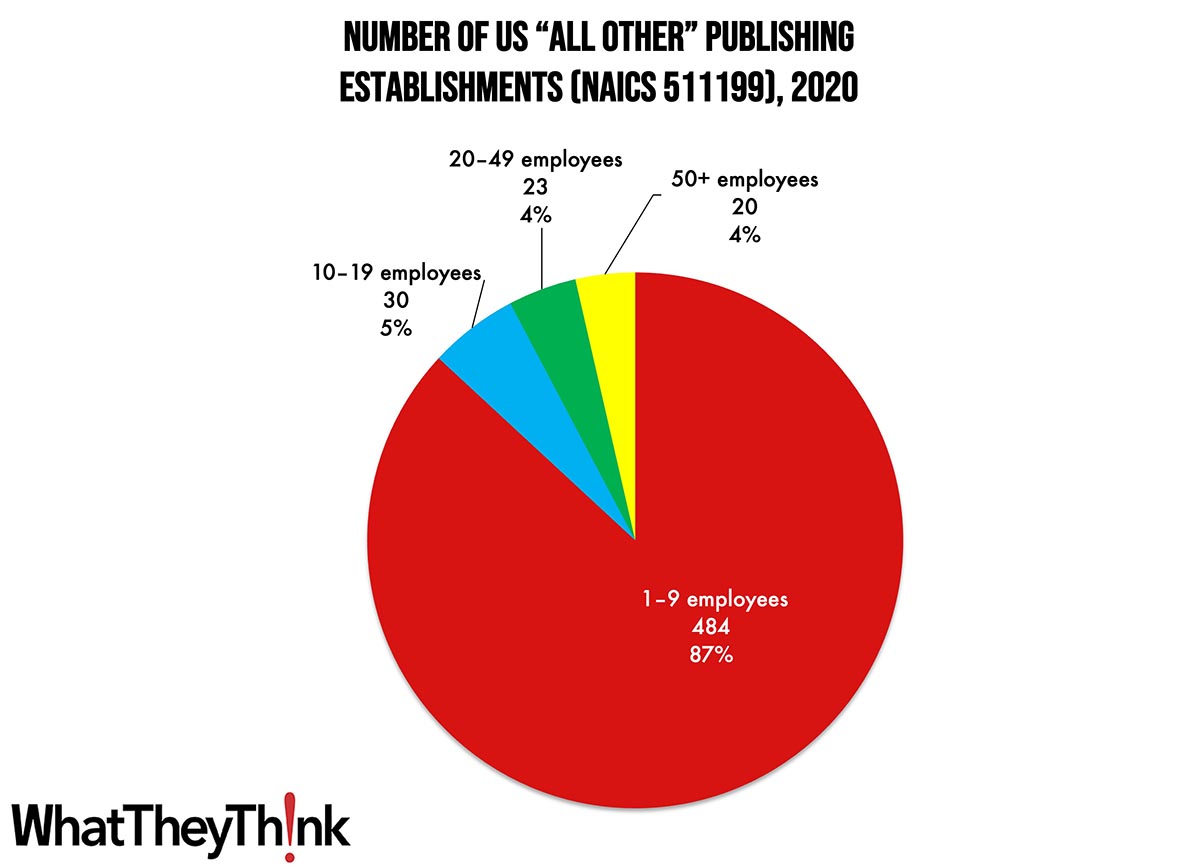
Regardless of what they produce, publishing establishments in this category are concentrated at the lower end of the employee-count spectrum. Small publishers (1 to 9 employees) account for 87% of all establishments, with the other three size classifications just about equal at 4–5%.
These counts are based on data from the Census Bureau’s County Business Patterns. Every other week, we update these data series with the latest figures. These counts are broken down by printing business classification (based on NAICS, the North American Industrial Classification System). Next time, we’ll look at:
- 51913 Internet Publishing and Broadcasting and Web Search Portals
To clarify what is included in the 2020 CBP, establishment counts represent the number of locations with paid employees at any time during the year. If an establishment existed at any point during the year, it would be included in the CBP count of the number of establishments for 2020 CBP. Thus, businesses lost during the COVID pandemic won’t be accounted for until the 2021 CBP.
These data, and the overarching year-to-year trends, like other demographic data, can be used not only for business planning and forecasting, but also sales and marketing resource allocation.
This Macro Moment…
Uh oh: inflation ticked up in January. From the BLS:
The Consumer Price Index for All Urban Consumers (CPI-U) rose 0.5 percent in January on a seasonally adjusted basis, after increasing 0.1 percent in December, the U.S. Bureau of Labor Statistics reported today. Over the last 12 months, the all items index increased 6.4 percent before seasonal adjustment.
The biggest contributor:
The index for shelter was by far the largest contributor to the monthly all items increase, accounting for nearly half of the monthly all items increase.
Core CPI rose 0.4%, and if you back out shelter, core CPI rose only 3.9% year over year. Said Calculated Risk:
inflation has clearly peaked. And since rents are falling faster than seasonally normal - due to the pandemic related changes in household formation - it makes sense for the short term to use core CPI ex-shelter.