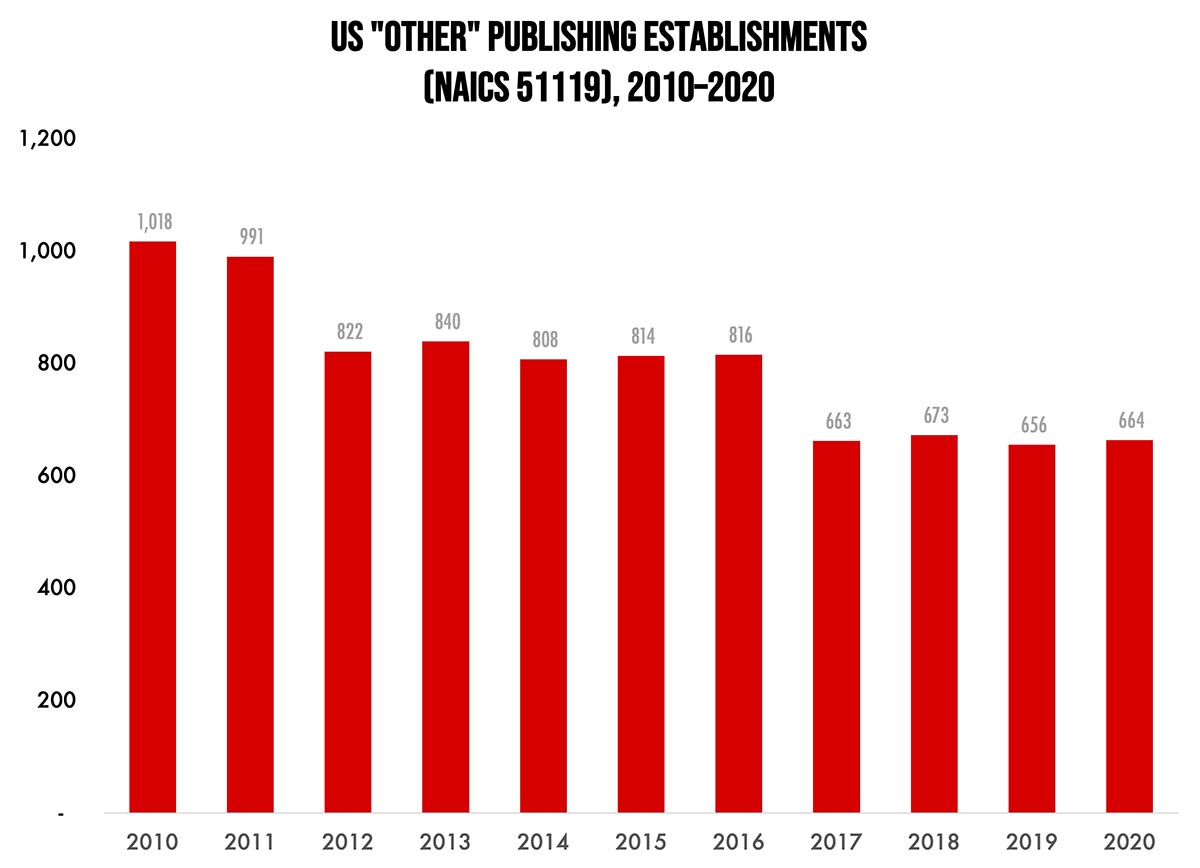
Our Friday data slice’n’dice look at the latest edition of County Business Patterns has been detailing the publishing industries. As 2020 began, there were 664 establishments in NAICS 51119 (Other Publishing), a decrease of 35% since 2010.
This category includes—as the name suggests—a mix of assorted types of publishers. The official description of this NAICS from the census Bureau identifies it thusly:
This industry comprises establishments known as publishers (except newspaper, magazine, book, directory, mailing list, and music publishers). These establishments may publish works in print or electronic form. (This category includes publishers of art prints, greeting cards, calendars, and others.)
Greeting card publishers are given their own sub-NAICS (511191), which we’ll look at separately in our next slice’n’dice installment.
A lot of the applications produced by businesses in this catchall still remain popular print items, even if the method of their production may have changed, which is why establishments have declined by only about one-third over the past decade. Some general trends that affected these businesses:
- Print postcards have been replaced by posting pictures of trips and events on social media sites.
- Art prints are increasingly produced digitally on inkjet equipment like Epson SureColor units.
- Wall and “page-a-day” calendars are still strong, despite electronic calendars.
- Printed maps are almost entirely replaced by GPS/Google Maps, but there is somewhat of a market for historical maps.
To clarify what is included in the 2020 CBP, establishment counts represent the number of locations with paid employees at any time during the year. If an establishment existed at any point during the year, it would be included in the CBP count of the number of establishments for 2020 CBP. Thus, businesses lost during the COVID pandemic won’t be accounted for until the 2021 CBP.
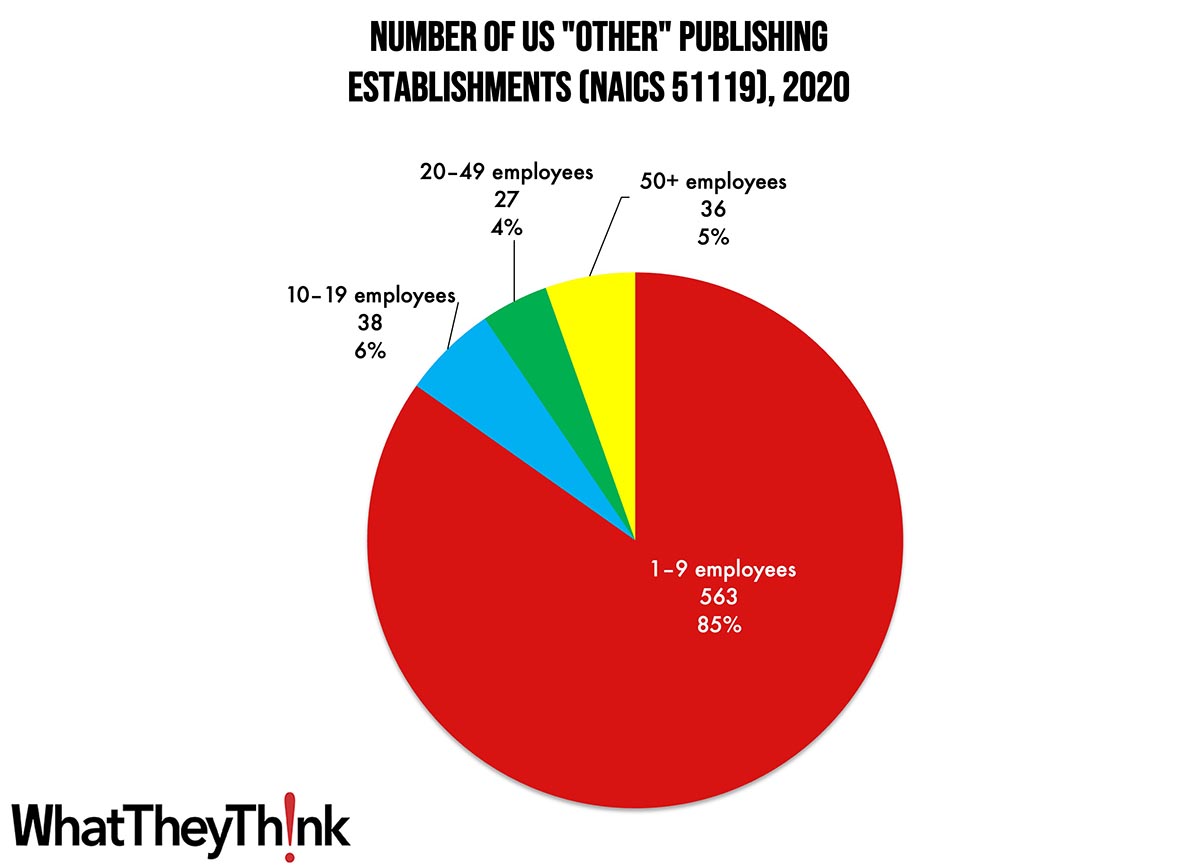
“Other” publishing establishments are concentrated at the lower end of the employee-count spectrum. Small publishers (1 to 9 employees) comprise the bulk of the establishments, accounting for 85% of all establishments, with the other three size classifications just about equal and under 10%.
These counts are based on data from the Census Bureau’s County Business Patterns. Throughout this year, we will be updating these data series with the latest CBP figures. County Business Patterns includes other data, such as number of employees, payroll, etc. These counts are broken down by commercial printing business classification (based on NAICS, the North American Industrial Classification System). Up next:
- 511191 Greeting Card Publishers
- 511199 All Other Publishers
These data, and the overarching year-to-year trends, like other demographic data, can be used not only for business planning and forecasting, but also sales and marketing resource allocation.
This Macro Moment…
Ask anyone in this industry—or even elsewhere in the economy—about their staff hiring experiences, and they’ll likely tell you that it’s virtually impossible to find employees. This has been an ongoing phenomenon. But why? Over at The Big Picture last month, Barry Ritholtz identified some of the factors behind the current worker shortage.
One that he identifies is one we have been commenting on: the Great Resignation/Reshuffling/Whatevering:
The Great Labor Reset: The past 3 years have seen record new business formation. There are various theories as to why this is, but I suspect it is simply lots of people buying into the American Capitalist dream of being their own boss. This is what happens when you lock people inside 18 months, and give them a few trillion dollars: A sizable percentage of them will upskill and launch their own shops. It is one of the more intriguing aspects of the past few years.
As we have pointed out in the past, this is actually a good trend for our industry as new businesses often need the kinds of things that printers produce, such as marketing materials and collateral, business cards, and even signage and display graphics.
Another trend Ritholtz identifies is less good news for us: lagging wages.
Among the bottom half of workers, wages have lagged just about everything: Inflation, productivity, stocks, executive comp, and median wages. At the entry-level or minimum pay scale, it’s even worse (see chart at top). Then came the reckoning: After a half-century of wages as a deflationary force, the Balance of Power shifted. What has been occurring since is mostly catch-up.
In many fields, it’s not so much that there aren’t enough workers, but rather, there aren’t enough workers at the prior low wages firms were offering. This has revealed challenges in specific business models, including fast food and discount retail.
Another contributing factor is that legal immigration is at record lows, a trend that began in the 1990s and has only continued.
If we were to return to the level of immigration that we saw in the 1990s, it would go a long way towards solving our labor shortage – about ~3,000,000 workers over the past 5 years (pre-pandemic).
And then of course there was the pandemic. The US alone reported about 100 million COVID cases and more than a million deaths (actual final numbers are probably higher). There are also a rising number of people suffering from still-mysterious but very real phenomenon of “long COVID”—by some estimates, that could be about 15 million people or more, many of whom find they can no longer work in cognitively intensive jobs. (Although recent evidence suggests that long COVID may clear up over time.)
Some of these trends are temporary (let’s hope COVID is) but some may not be—and it seems likely that 2023 will be a sort of “reckoning year” for much of the economy. Still, despite the root cause(s), hiring staff remains a persistent problem for our industry, which is what is driving the accelerated trend toward automation.


