WhatTheyThink

Premium Commentary & Analysis

More Economic Sameness

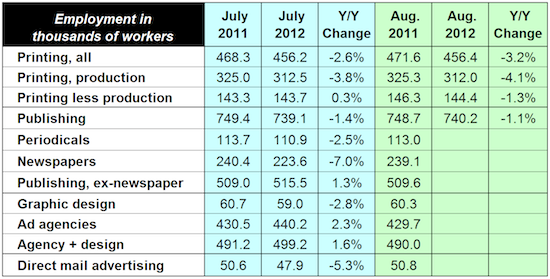
Dr. Joe explains last Friday's employment report, takes a look at employment in our industry, and explains why ad agency revenues are going up when everything else seems to be going down. Speaking of down, sit down before you read his comments about the latest recovery indicators. Yes, Dr. Doom seems to have infiltrated this column, again.

Monday, September 10, 2012

Friday's unemployment report was a bit more dreadful than the experts expected. There was a strong payroll employment report from ADP, who should know these things since they process the payroll of so many businesses. Some employment market watchers got excited because payrolls rose 201,000, according to ADP, only to be disappointing by the Bureau of Labor Statistics the next day, with payrolls increasing by only 96,000, well below expectations.  The BLS report also included downward revisions to the data of prior months. (There was a good blogpost on wsj.com explaining how silly it is to pick apart the ADP data for differences compared to BLS, since their estimate differed by only less than 1% of the total workforce).

The unemployment rate fell from 8.2% to 8.1%, so why all the concern? The rate fell for the wrong reasons, again.

And what should we really have expected? The Bureau of Labor Statistics reported that productivity rose +2.2% in Q2-2012 compared to Q1. GDP grew +1.7% in the latest estimate. Any time that productivity is greater than GDP for long periods of time, unemployment will worsen. When GDP exceeds productivity, employment improves because more workers are needed. The pattern for GDP being less than productivity has been intact for some time.  

The household survey is a more important part of the monthly employment in the grand context of things. It includes self-employment and freelancers, is the basis of the calculation of the unemployment rate. While mainstream news outlets and wire services focus on the payroll survey changes, the real economic story is almost always in the household report. The data were particularly disappointing, and may imply further economic contraction ahead.

You may have heard that the unemployment data lag the economy. What lags the economy is the reporting of the unemployment rate, not the number of employed persons. The number of workers employed generally moves in lockstep with economic growth. Because the unemployment rate uses the total of job holders and job seekers as its denominator, the rate can temporarily get worse because new workers who are encouraged by a stronger economy flood the workforce at a rate faster than it can absorb them. That increases the denominator faster than the numerator can keep up.

We have the opposite here. The economy is sluggish, at best, so many job seekers have other options than continuing to seek employment. The denominator keeps getting smaller at a faster rate than the number of job holders. Even if the number of job holders goes down, as long as it decreases more slowly than the denominator, the unemployment rate can actually improve.

The contraction of the workforce is being complicated by some other factors, notably the age of the baby boomers. Some are retiring, some are working longer. The economy is so diverse that opposite trends can be in place at the same time and be very substantial in size.

Many boomers are delaying retirement to re-build their nest eggs either from value losses in retirement funds, fear of future inflation, or to compensate for the low rates of returns on many conservative investments. The proportionately biggest growth in employment has been in older workers. Many of these workers have savings, and the objective of their going back to work is to reduce their rate of drawdown from their savings, or to avoid the drawdown completely. Many work for less money than they would have at an earlier stage life, and in the process might crowd out younger inexperienced workers, even if "younger" means "thirties" or "forties."

Some unemployed workers are leaving the workforce via Social Security disability at a rate greater than trustees anticipated. Some of these workers are younger than the boomers, but finding a way to continue to receive transfer payments after their unemployment payments run out.

Printing employment continues to shrink, down -15,200 since last year. In general terms, August and September often have slight increases in employment because of the increase in printing for retailers. Every year, retailers have shifted their plans to include more digital media. This year, it may become more complicated because of the slower economy, and the reallocation in continued favor of digital may be somewhat constrained. The decrease in production employment is approximately the same as the decrease in inflation-adjusted print volume.


Continue reading your article
with a WhatTheyThink membership.

WhatTheyThink Annual Membership

Less than $4/week.

Get unlimited access to in-depth commentary and analysis covering the latest trends, emerging technologies, operational strategies, and key events across every segment of today's printing industry.

Stay informed. Stay competitive. Stay ahead.
WhatTheyThink Day Pass

$5 for 24 hours

Unlimited access to all of WhatTheyThink. Get your Day Pass

Already a member?
Sign In

About Dr. Joe Webb

Dr. Joe Webb is one of the graphic arts industry's best-known consultants, forecasters, and commentators. He is the director of WhatTheyThink's Economics and Research Center.

Recent Articles from Dr. Joe Webb

Big Printers' Writedowns and Interest Payments Are a Big Drag on Printing Industry Profits

Big Printers' Writedowns and Interest Payments Are a Big Drag on Printing Industry Profits

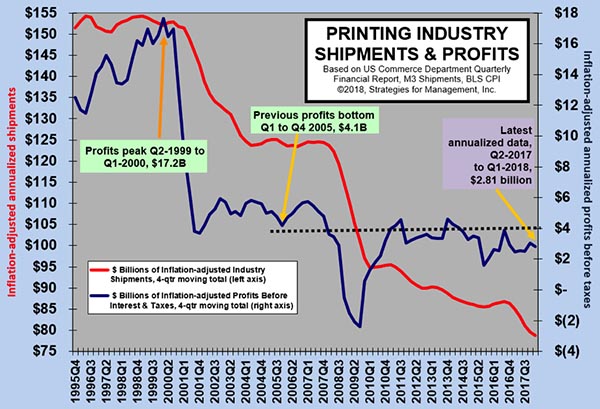
Writedowns in the first quarter of 2018 for commercial printers with $25 million or more in assets were $157 million, or 1.9% of sales. The assets may be written down, but the borrowing that was created to finance them remains. Interest expense was 4.8% of sales. For the quarter, losses were -1.47% of sales. That rate of loss made average profits before taxes for the industry a mediocre 3% of sales—which means that printers with less than $25 million in assets must have done well. Read More

The Final Column: The Security Guard Will Take Your Badge and Escort You to the Lobby

Back in 2002, Dr. Joe agreed to do a regular column for WhatTheyThink for “only one year and no more”...for 15 years. This farewell column explains how it started, behind-the-scenes intrigue, the problems, and why it turned out the way it did. And then…he explains the exciting adventures ahead. Read More

Full-Time Employment, Sets New Record, Up +904,000, But Does It Really Feel that Good?

Full-Time Employment, Sets New Record, Up +904,000, But Does It Really Feel that Good?

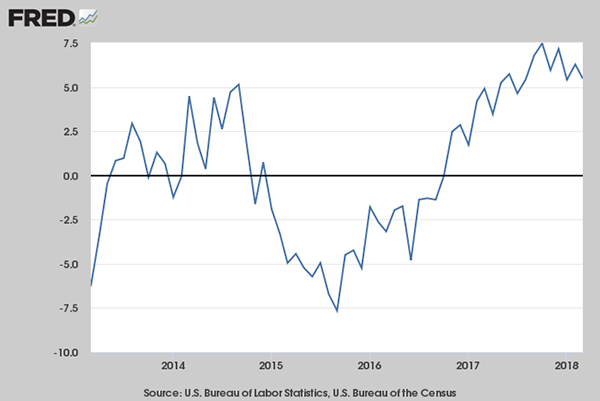
The May employment report was regarded as good, but when you dig past the top-level numbers, it was better than it looked. However, while the 3.8% unemployment rate looks good on the surface, it really can’t be compared to when it was last attained nearly 20 years ago. So many workers left the workforce that this figure implies a tighter labor than it really is. We will really know we have a strong economy when the active labor force starts increasing. Read More

Good News Could Be a Full-Time Job, but for Most Economists It’s Only Part-Time

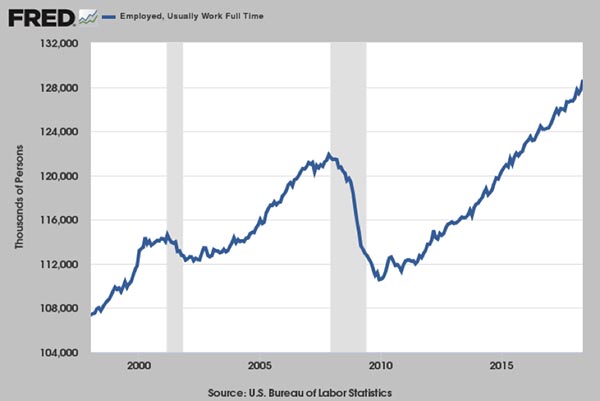
Some people say that the news is always bad, and they wish someone would report good news now and then. There is good news but no one seems to report it. You’d think that would be a full time job for someone. The economy has set a record for full time employment, and all we hear are crickets. The economy has been doing better lately in some key measures of employment, but the Fed is scaring markets by preparing to raise rates. TINA, meet TAMA, the result of the Fed’s actions; don’t worry, we’ll explain it. The statisticians at the Commerce Department revised printing shipments data. Revising data seems to be a full time job in the Beltway. Dr. Joe clarifies it all for one nearly last time. Read More

Consumer Durable Goods Orders Moving at Almost 2X GDP Rate

Consumer Durable Goods Orders Moving at Almost 2X GDP Rate

Durable goods orders for consumers (less transportation) are growing at a rate almost two times faster than Real GDP. This data series remains -14% below where it was at the start of the recession in December 2017, and is a critical one to monitor for indications of an improved economy. Read More