The Publishing Market of 2014
There is an interesting report from syndicated columnist John Leo about a “mockumentary” called “EPIC 2014.” This 8-minute video discusses the future of the publishing business, and I strongly suggest everyone view it. It’s very thought-provoking. I recommend that you read John Leo’s column first. It’s where we’re headed.
On the web:
I also recommend, again, Bob Garfield’s “Chaos Scenario” from Advertising Age. Here’s a strategic recommendation: corporate repositioning can be best accomplished in a period of chaos, and it’s a good chance to jump ahead of traditional competitors.
Inflation-adjusted Printing Shipments: How Do We Know They’re Right?
Occasionally I get notes from readers asking how I calculate the inflation adjusted printing sales and profits, suggesting that my inflation adjustment would be improved if I used a different method. The Consumer Price Index, which is what I use, certainly has its problems. It’s created using a specific, fixed basket of goods, tracking how those prices change over time. The contents of the basket are occasionally revised to reflect new products or changes in tastes. For instance, twenty five years ago, the idea of consumers buying computers and computer-based goods would not have even been considered in creating a CPI.
Another problem with the CPI is that the fixed basket assumes there is steady demand for those goods. That is, it assumes that consumers will not change their behavior to avoid high prices or take advantage of lower prices. This is one reason why Alan Greenspan prefers to look at the adjustment for inflation to Personal Consumption Expenditures that is part of the measurement of Gross Domestic Product. This calculation is more dynamic. For example, if people decide to stay home and watch a pay-per-view movie rather than go to a movie theater or to eat at home rather than go out to eat because of high gasoline prices, the inflated price is avoided. The CPI assumes no change in behavior; the PCE adjusts for inflation of what is actually purchased.
The other measure often suggested is the Producer Price Index, which shows how costs change at the point goods and services are created, and not at the consumer level. I prefer to use the final dollars of the CPI when they are fully in the marketplace, having passed through the entire value chain. Since a characteristic of the economy for about a decade has been the inability, at various times, to pass increased costs to consumers and tougher pricing competition, I have never trusted the PPI to fully report the conditions of the marketplace.
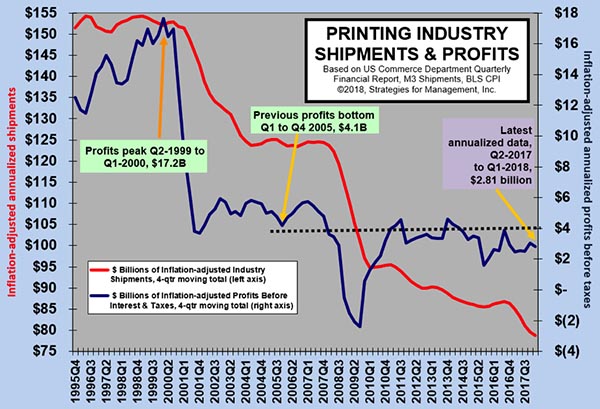
To understand the various effects, I used each of the inflation gauges and produced the two charts below. The charts are different depending which base year you choose. I used 2000 and 2004 as my base years. As you get further away from the base year, the process of compounding becomes very evident.
The black line is current dollars, and it can be seen from the charts how not adjusting for inflation may cause one to make flawed judgments about how “good” or “bad” things might be. More about that later.
Below is the chart that uses 2004 as the base year. The CPI, which is often accused of over-estimating inflation (whether or not we know for sure is up to academic debate, but watching economists throw things at each other is kind of fun, so I hope they never settle it) lives up to its reputation by having the highest line until 2001. There, the PPI becomes the highest (I used the manufacturing PPI data series), indicating that increased manufacturing costs could not be passed on to the consumer. In fact, anytime the PPI spikes up at a higher rate than the CPI, such as 1997-1998, this was the case.
The PCE adjustment is, for the most part, the lower estimate of inflation’s effect.
Data cluster around whatever base year you select because those closest values are subject to the least adjustment (remember, the effect of the inflation adjustment method you choose compounds over time). This is obvious from the chart below, where 2000 is the base year.
The behavior of the adjusted data series is about the same: the CPI line shows a greater range, PCE is more limited, and PPI’s effect is as stated earlier.
These data are annual data; in my other models I use monthly data in a 12-month moving average, with each month adjusted using the CPI. PCE is available only in quarterly format. The PPI specific to printing is a new data series and only goes back to 2000; while it is monthly, it is published three to six months later than the general PPI and the CPI. My monthly calculation shows a different peak year for the industry, but at that time (1998-2000) the industry was rather flat from a statistical standpoint (though they were very good years).
Note how the black, unadjusted line shows a different picture. There, the industry was steadily growing until 2000, and the decline seems rather mild, putting industry shipments where they were in 1996, and seeming to be flat since 2002. The peak year was 2000 in this data series, but the PPI and CPI lines show 1998 as the peak year. The PCE shows a flat market from 1998 to 2000. The CPI adjusted series show a moderately flat market from 1995 to 2000. All of the adjustments by 2004 show a $6 to $7 billion negative variance from the actual data.
Whatever the case, no matter which inflation adjustment is selected, they all reflect the same basic conclusion: things are different than any “current dollar” scenario shows. Inflation-adjustment is a good idea even for individual companies, since it can assist managers to understand to what degree their decisions have really impacted their businesses. Inflation distorts perceptions about the past, and that is unfortunately what management must often base their decisions upon. If you don’t know your history, you may be doomed to repeat the mistakes of the past. But inflation-adjustment may make things that were considered big successes look more like they just rode a fortuitous rising tide of worthless money.
Who Bears the Brunt of Bad Forecasting? Rarely the Forecasters!
If experts and Treasury economists can’t forecast well, is there any penalty to pay? None. “Experts” are always surprised by economic data, and the Treasury economists missed projections relative to the surge in tax collections at Federal and State levels. Now the “experts” worry that declining oil prices mean that the economy is slowing, the same “experts” who thought that increasing oil prices would translate to an economic slowdown.
What about those CEOs who beat up sales people and others when sales don't turn out as hoped? Sales people are notoriously bad forecasters (I’d rather have a sales rep who’s good at sales than a great sales forecaster, wouldn’t you?) I have seen sales forecasting processes that are so filled with intimidation that no one is willing to acknowledge true and accurate market conditions. I am often amazed at how frequently I have gone into a company whose sales are in trouble, whose executives insist they have problems in marketing or customer adoption, yet who have overforecasted the market. This is much like the experts who create meaningless expectations when the real data is so much more actionable. Foolishly adhering to budgeted sales forecasts in the face of changed marketplace conditions is managerial malpractice. If you believe the marketplace is to be navigated and not feared, you must have a clear idea of cause and effect, and of reality and myth, and take action accordingly.
This problem occurs not only when things seem to be tanking; it's when the marketplace is booming, as well. I have also seen situations where a business is so focused on one sector, it became convinced that its poor fortunes there were besetting all of its competitors. "How could they be selling X for $Y when it costs us $Z?" they would often ask, continuing, "They'll go out of business at those prices." The competitors never did; instead, they grew. I’m sure the same sentiment was uttered about Sam Walton, founder of Wal-Mart and Herb Kelleher, founder of Southwest Airlines. The poor-performing company failed to grow because it never took the necessary steps to be in growth segments and rarely ventured out to even measure potential opportunities. Therefore, its assumptions about market conditions were wrong, and they would underforecast their opportunities, moving from quarter to quarter, satisfied with lackluster performance, thinking mediocrity was exceptional. Keep company politics out of forecasting, and keep forecasting separate from goal-setting. Knowing the difference between the two is a characteristic of good management.
Forecasting and market-sizing is hard work, and it requires that vested interests be more interested in reality than visions. A good forecast tells the entrepreneur the condition of the marketplace. The entrepreneur or manager, then, has a better sense of what it really takes to change a marketplace. Hopes and dreams are nice, but good execution is better.
Somehow this reminds me of a quote by gangster Al Capone: “You can get much farther with a kind word and a gun than you can with a kind word alone.” To paraphrase: You can get much further with a bad forecast and good management than you can with a bad forecast and managers who are unwilling to adapt.
On the Web:
Al Capone at one time worked in the printing industry as a cutter in a book bindery; later, his murderous activities gave a different meaning to the word “finishing.”