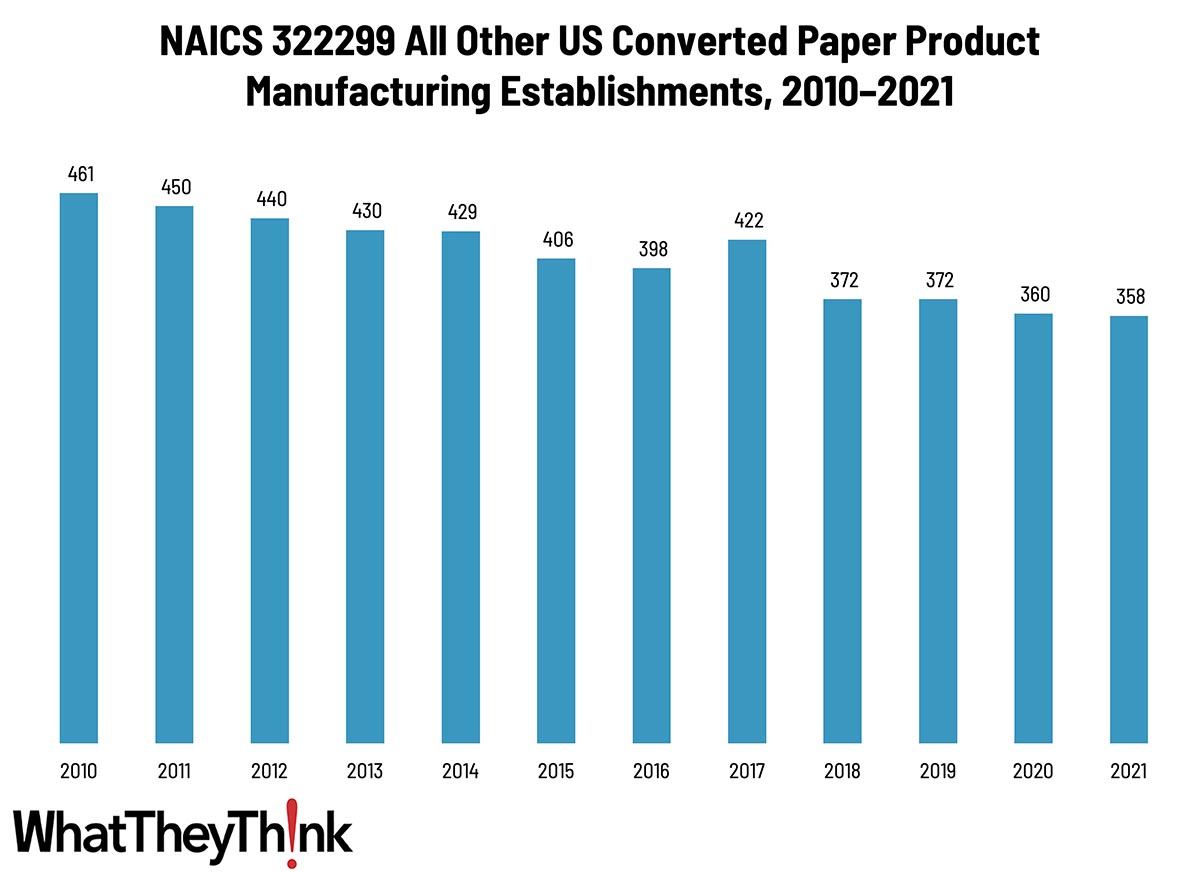
According to County Business Patterns, in 2021, there were 358 establishments in NAICS 322299 (All Other Converted Paper Product Manufacturing). This NAICS category has declined steadily over the course of the decade, although not as dramatically as some of the other categories we have been looking at, and there was a big spike in 2017.
The Bureau of the Census definition for this business classification:
This U.S. industry comprises establishments primarily engaged in converting paper or paperboard into products (except containers, bags, coated and treated paper, stationery products, and sanitary paper products) or converting pulp into pulp products, such as egg cartons, food trays, and other food containers from molded pulp.
Basically, this category comprises the establishments in 32229 (which we looked at previously) with 322291 (Sanitary Paper Products Manufacturing) backed out.
As we said in our commentary on 32229, since this product category largely comprises food trays, egg cartons, and a similar hodgepodge of food packaging-related products, trends in this packaging category will depend upon trends in the types of food they contain. For example, starting in 2018, egg consumption had been increasing and creative egg packaging was seen as an “uncracked market,” according to the American Egg Board. Competition from foam-based food trays and cartons was and continues to be substantial, and while cushioning, cost-effectiveness, and moisture-impermeability work in foam’s favor, biodegradability/sustainability works in the favor of paper-based trays/cartons. At the time, there was also increased demand for food trays/packaging (take-out, restaurant leftovers, school and cafeteria use, etc., e.g.), but had been moving in foam’s direction. (There was of course a spike in home delivery/take-out during the lockdowns of 2020, so it will be interesting to see what this data series looks like next year.) At the same time, the increasing number of municipal bans on foam takeout containers can work to paper’s advantage.
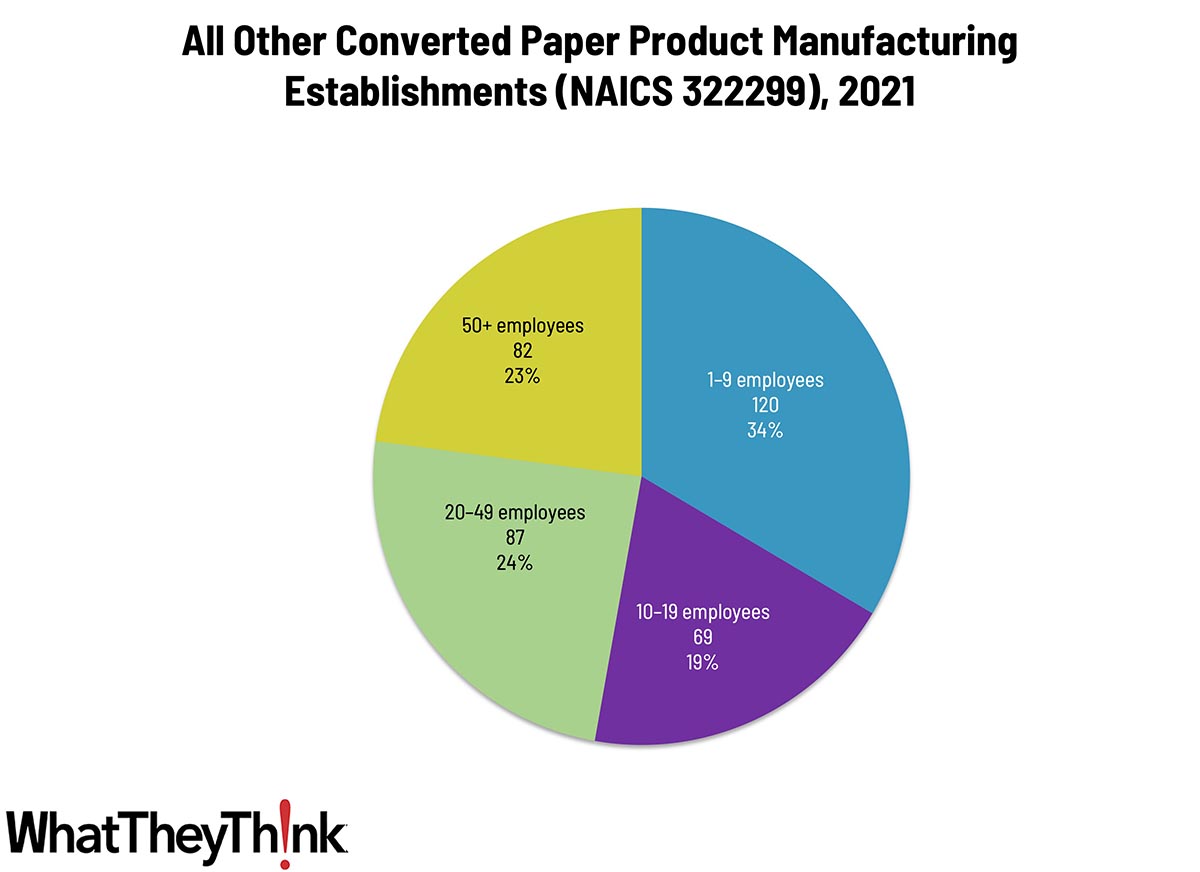
Establishments in this category are pretty evenly distributed. Small converted product manufacturers (1 to 9 employees) account for 34% of all establishments, large manufacturers (50+ employees) account for 23% of establishments, and mid-size establishments (10–49 employees) account for 53%.
These counts are based on data from the Census Bureau’s County Business Patterns. Every other week, we update these data series with the latest figures. These counts are broken down by printing business classification (based on NAICS, the North American Industrial Classification System).
To clarify what is included in the 2021 CBP, establishment counts represent the number of locations with paid employees at any time during the year. If an establishment existed at any point during the year, it would be included in the CBP count of the number of establishments for 2021 CBP. Thus, this series includes those businesses lost during the COVID pandemic.
These data, and the overarching year-to-year trends, like other demographic data, can be used not only for business planning and forecasting, but also sales and marketing resource allocation.
Next up: signage!
- 33995 Sign manufacturing establishments
- 541850 Outdoor Advertising
This Macro Moment…
According to the Bureau of Labor Statistics (BLS) on Wednesday:
The Consumer Price Index for All Urban Consumers (CPI-U) increased 0.2 percent on a seasonally adjusted basis, the same increase as in July, the U.S. Bureau of Labor Statistics reported today. Over the last 12 months, the all items index increased 2.5 percent before seasonal adjustment.
That 2.5% 12-month inflation rate is the lowest since February 2021. It’s probably safe to say that inflation is under control. The biggest contributor was shelter (as it often is), which was up 0.5% in August. Food inflation was only up 0.1%.
More good news is that real earnings also rose, with average hourly earnings outpacing the monthly CPI increase by 0.2%, adds CNBC.