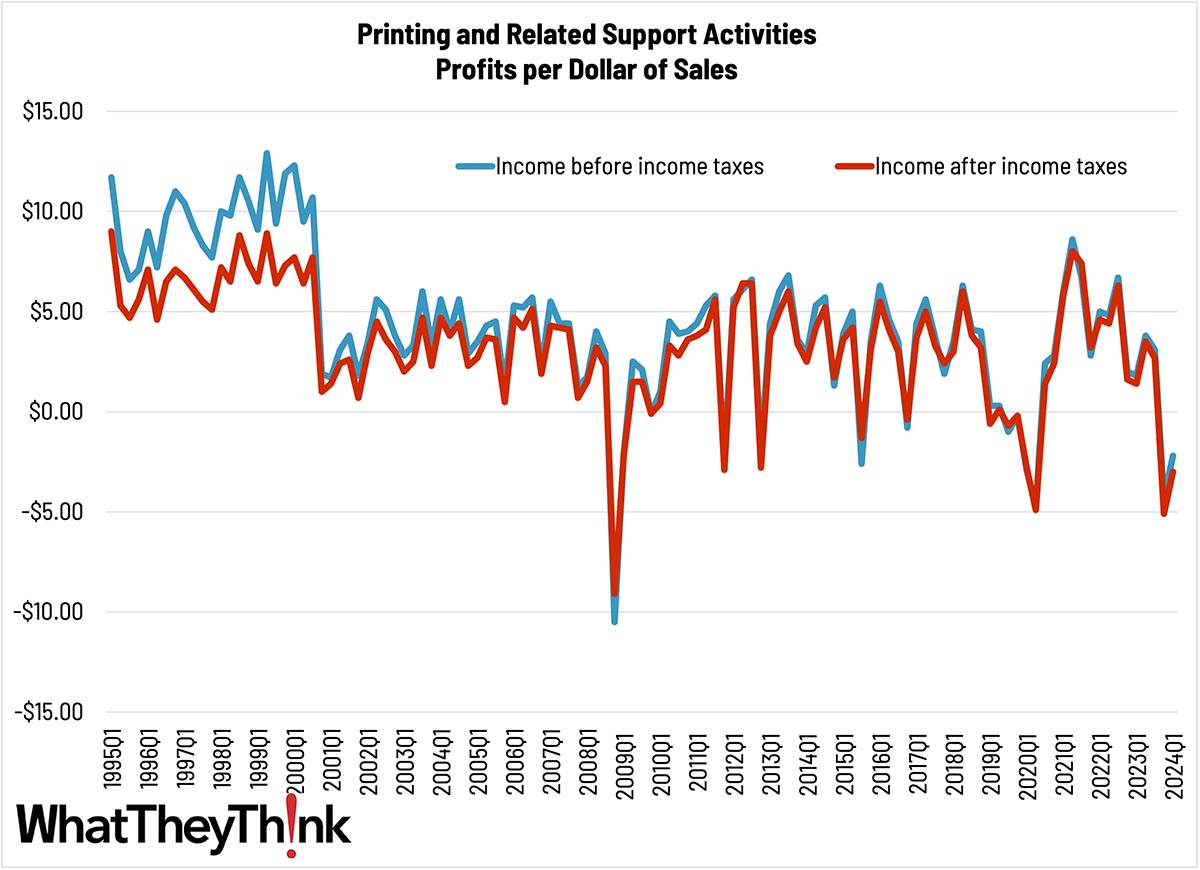
We haven’t looked at profits data in a while, and while quarter-over-quarter profit margin data can be fairly noisy (we used to look at profits as a four-quarter moving average to smooth things out a bit) the industry in general had been on an upward trend since the trough of the pandemic. Profits took a huge hit in Q4 2023, while Q1 has seen a slight struggling back upward. There’s very little mystery as to what’s going on—expenses have risen and print jobs haven’t been able to be priced accordingly. And with print buyers seemingly convinced there is a recession around the corner (though there is no sign of one) they are not spending as much on print as they potentially could.
In Q1 2024, for large printers (those with more than $50 million in assets), profits before taxes had been -2.12% of revenues, while for smaller printers (less than $50 million in assets), profits before taxes in Q1 were -2.27% of revenues. We have traditionally seen a large profit disparity between “big” and “small” printers which we quaintly call the “Tale of Two Cities.” That rift had temporarily closed during the pandemic, it came back briefly, but now it looks like it has vanished again. We may need to find another Dickens novel—no, not Bleak House.
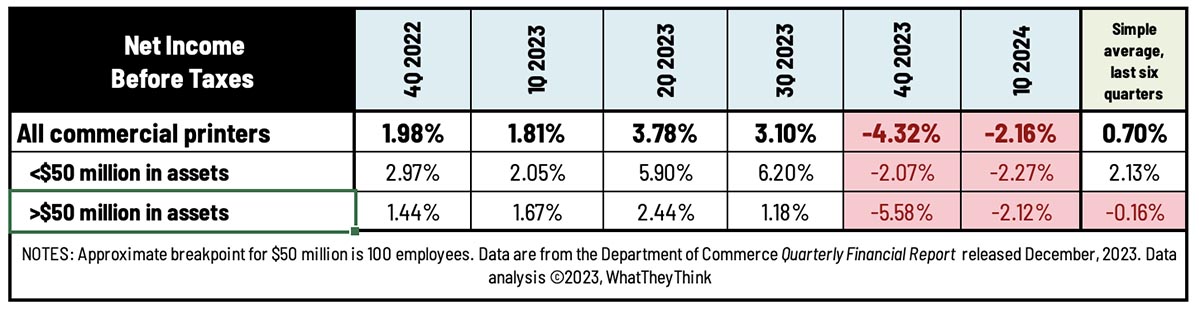
Anyway, in Q1 2024, for the industry on average, profits before taxes were -2.16% of revenues, up from Q4’s dismal -4.32%. For the last six quarters, profits have averaged +0.70% of revenues. Let’s hope Q2 data show a better trajectory.
The asset class division is based on the breakdowns in the Census Bureau’s Quarterly Services Report, whence we get our profits data. Starting with the Q4 2019 Quarterly Services Report, the Census Bureau changed their asset class breakdowns from more/less than $25 million to more/less than $50 million. We’ve run the course of this change affecting recent historical comparisons so this will be the last time we mention it.