The printing industry is a sizeable industry in Europe. However, much of the industry is below the radar of many observers, as many smaller companies contribute to the activities, and print production is spread out across many types of producers. Graphic arts print, often also termed commercial print (including publication and specialty print in this overview), is the biggest contributor to revenue, employment, and the number of establishments. Prepress and postpress companies, part of the graphic arts industry, contribute to the revenue as well, although strictly speaking they do not print.
Revenue Developments for Print
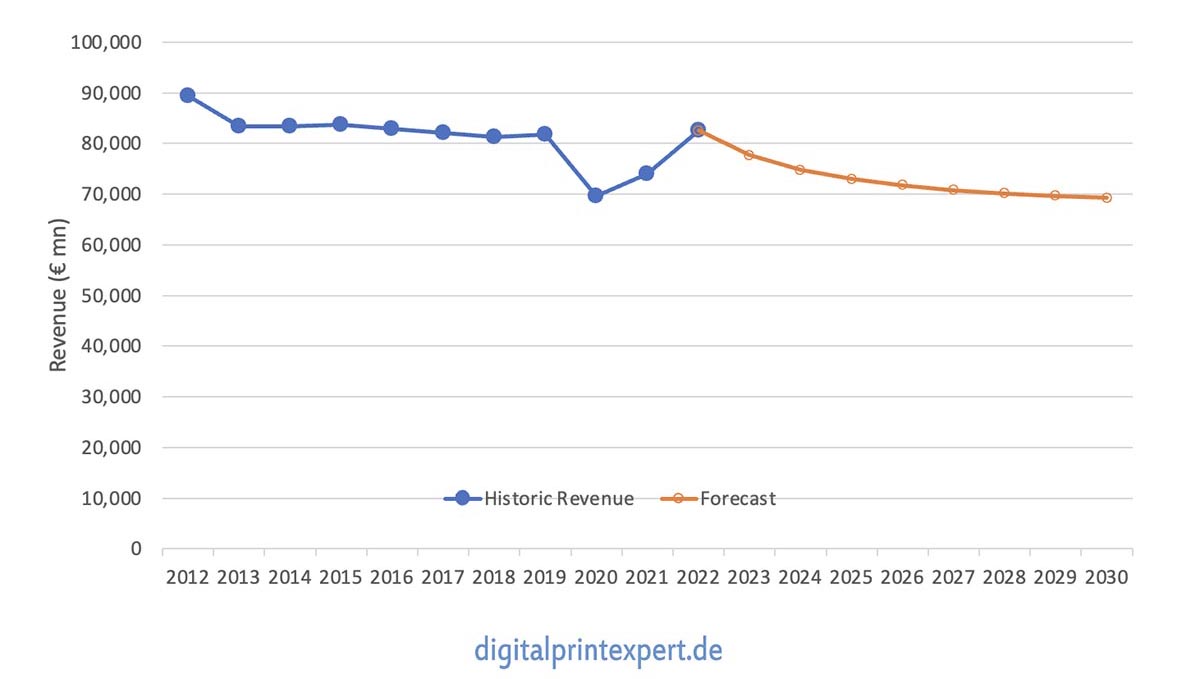
Total European print revenues have been surprisingly stable in recent years. Revenue declines in Western Europe were balanced by revenue gains in Eastern Europe. Increases in Central and Eastern European revenues stem from internal demand increases and expanding exports into Western Europe, a pattern that becomes apparent in the country details.
The exception to the steady revenue development has been the pandemic year of 2020 with a sudden, decisive decline of almost 15% compared to 2019 revenues. 2021 saw a quick recovery and 2022 revenues even surpassed 2019 values. It should be kept in mind, however, that 2022 revenues are bolstered by a high inflation rate driven by energy, paper, and supplies cost increases. These have been passed on to the customers resulting in higher end customer prices. The higher prices are going to have an adverse effect on demand, however, so we will not only see a demand decline but also a price erosion driving revenues lower in the coming years, especially in graphic arts print.
Graphic Arts Industry Revenue in Europe
Although they are not included in graphic arts industry statistics (which include newspaper print, graphic arts print, prepress/pre-media services, and finishing), there are other important print producers that should be added—for a total of 10 segments contributing to the turnover in the printing industry. Those are:
- Folding carton printing
- Flexible packaging printing
- Corrugated printing
- Label printing
- Photocopy services
- In-house printing
Those segments add about the same revenue as the “graphic arts industry” total, with another €86 billion. In total, the European printing industry had revenues of about €170 billion in 2022, according to the 2024 European Print Industry Sizing report. Unfortunately, those segments have different statistical classifications and are not included in many print production statistics. Accordingly, they are more difficult to size and require some estimations, especially for the in-house print portion. Timelines are quite insecure as a result.
Print Enterprises in Europe
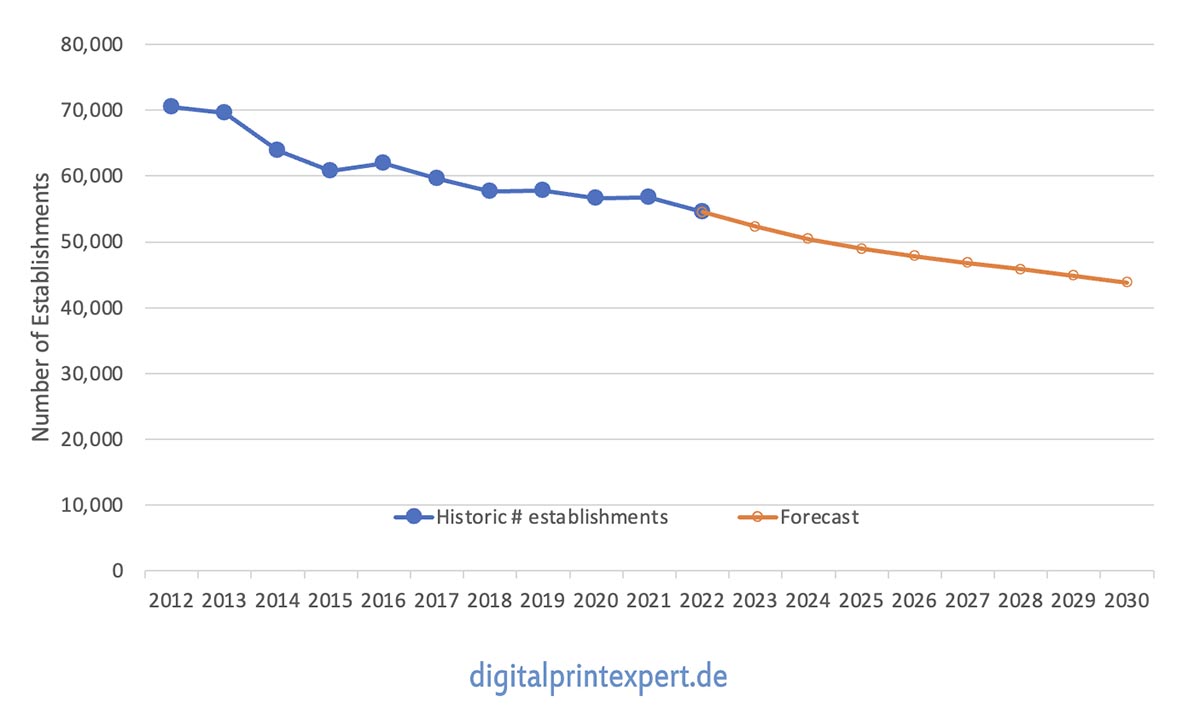
While revenues showed some up and down, the number of graphic arts establishments shows a steady decline—the effect of ongoing consolidation in the industry.
The number of establishments declined on average by 2.5% from 2012 to 2022. The forecast expects the decline rate to accelerate slightly. A reason is that companies have been kept alive by subsidies in the pandemic, which led to unusually low rates of shutdowns. Also, the rising operating costs currently will take its toll on companies not prepared to handle these cost and interest rate increases. While Eastern European companies helped to balance the total revenue in Europe, the number of enterprises has been stable or declining in most Eastern European countries as well, a sign of the general trend towards consolidation. The decline rates by country differ observably. Overall, the number of graphic arts establishments is likely to decline from more than 70,000 to less than 44,000 by 2030.
Graphic Arts Industry Establishments in Europe
The number of enterprises (or print operations for in-house print) in label, packaging, and copy services adds to this number. They contributed about 35,000 enterprises in 2022—or about 40% of the total in 2022.
Most companies in the graphic arts industry are small. More than 80% of all companies have less than 10 employees, even after adjusting for non-active and pro-forma companies often included in statistics, an effect that also distorts country comparisons. Interestingly, the share of companies in the middle-sized classes declined the fastest. Very small and large companies declined at a lower rate.
Share of companies by employee size class in 2022
|
1–9 |
10–19 |
20–49 |
50–249 |
250+ |
|
80.6% |
9.9% |
6.1% |
3.1% |
0.4% |
Further Industry Data
This article will kick off a bi-weekly series of pieces looking at country data. Starting with Austria, an overview of the 24 countries that make up the sizing will follow in alphabetical order.
A breakout of all segments by country and timelines for the number of establishments, revenue, and employment in the graphic arts segments can be found in the 2024 European Print Industry Sizing report. The report also features the number of companies by size class and country. The report can be purchased from the WhatTheyThink store. https://store.whattheythink.com/downloads/european-print-industry-sizing-2024/.
For questions and clarifications, please contact me at [email protected]