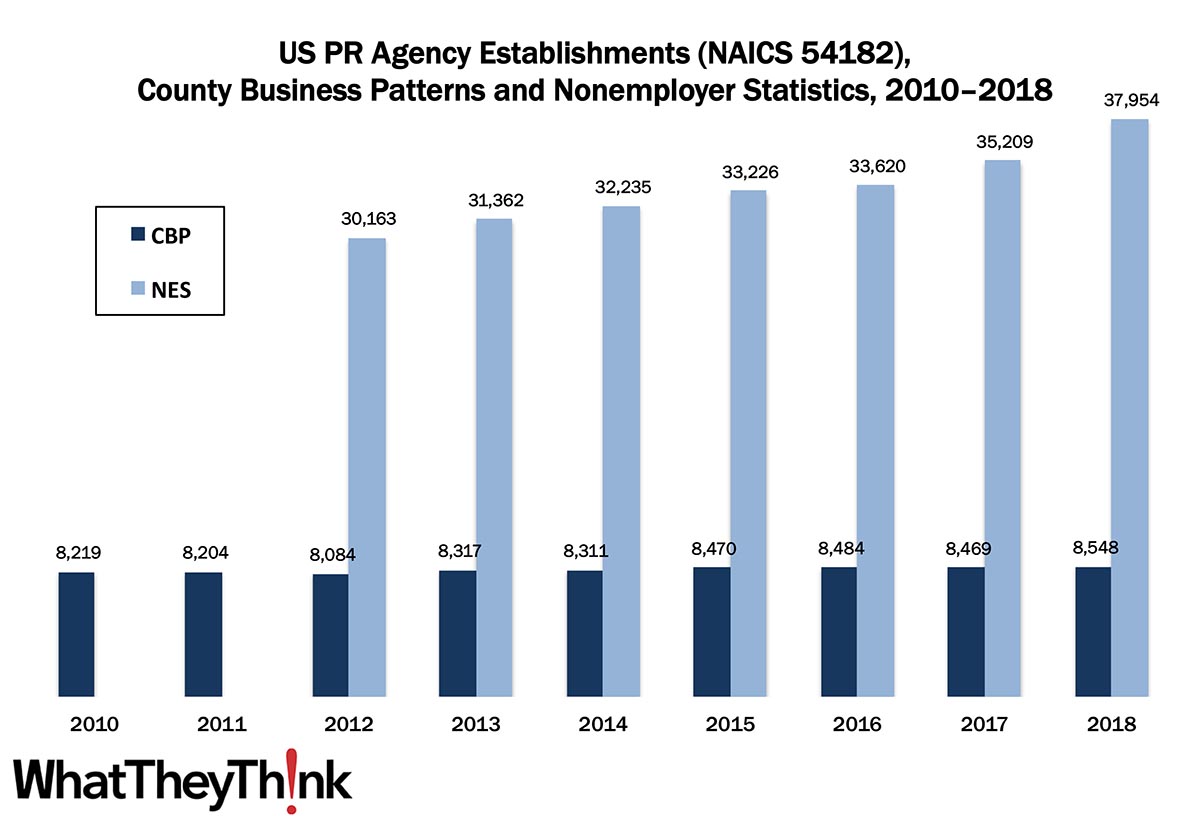
In 2010, there were 8,219 establishments in NAICS 54182 (Public Relations Agencies). After something of a contraction due to the Great Recession, agencies started to grow again, peaking at 8,548 establishments in 2018, according to the latest County Business Patterns.
A substantial number of PR agency “establishments” are counted as part of the Census Bureau’s Nonemployer Statistics (NES), which are essentially freelancers or independent contractors. As we pointed out two weeks ago in our look at advertising agencies, it’s tough to get an exact count of this particular category, as Nonemployer Statistics only goes as deep as four-digit NAICS codes. NAICS 5418 (Advertising, Public Relations, and Related Services) also includes advertising agencies, media buying agencies, outdoor advertising, etc., as well as “other services related to advertising,” which we will look at in turn. However, we can get a ballpark figure. In 2018, County Business Patterns counted 37,974 establishments in NAICS 5418, and establishments in 54182 accounted for 23% of them. In 2018, Nonemployer Statistics counted 168,608 establishments in 5418. Taking 22.5% of that would indicate 37,954 freelance or sole proprietor agencies establishments, up +8% from 2017. We have thus estimated the number of NES establishments going back to 2012 (which is as far back as NES goes).
Over the past 15 years or so, PR has become a more important function and has taken over large chunks of clients’ marketing efforts, especially where social media marketing is concerned. Social media management, search engine optimization (SEO), email campaigns, content marketing, and more are some of the functions of today’s PR agencies, in addition to the traditional PR tasks of writing press releases, hosting press events (be they live or virtual these days), and other activities.
These counts are based on data from the Census Bureau’s County Business Patterns and Nonemployer Statistics, which now include 2018 data. Throughout this year, we will be updating these data series with the latest figures. Census Bureau reports include other data, as well, such as number of employees, payroll, etc. These counts are broken down by publishing business classification (based on NAICS, the North American Industrial Classification System).
These data, and the overarching year-to-year trends, like other demographic data, can be used not only for business planning and forecasting, but also sales and marketing resource allocation.
Upcoming segments in our data slice’n’dice series will include the other “creative” markets:
- 54183 Media Buying Agencies
- 54185 Outdoor Advertising
- 54186 Direct Mail Advertising
Over time, we will be adding additional data from County Business Patterns, such as number of employees, payroll, and similar information for additional business classification of relevance to the graphic communications industry.
This Macro Moment
When last we had heard from the Bureau of Economic Analysis regarding GDP for the second quarter, they had estimated that it had declined at an annual rate of 32.9%. Yesterday, they released a revision:
Real gross domestic product (GDP) decreased at an annual rate of 31.7 percent in the second quarter of 2020, according to the "second" estimate released by the Bureau of Economic Analysis. In the first quarter, real GDP decreased 5.0 percent.
An infinitesimal improvement, to be sure, but we’ll take what we can get.


