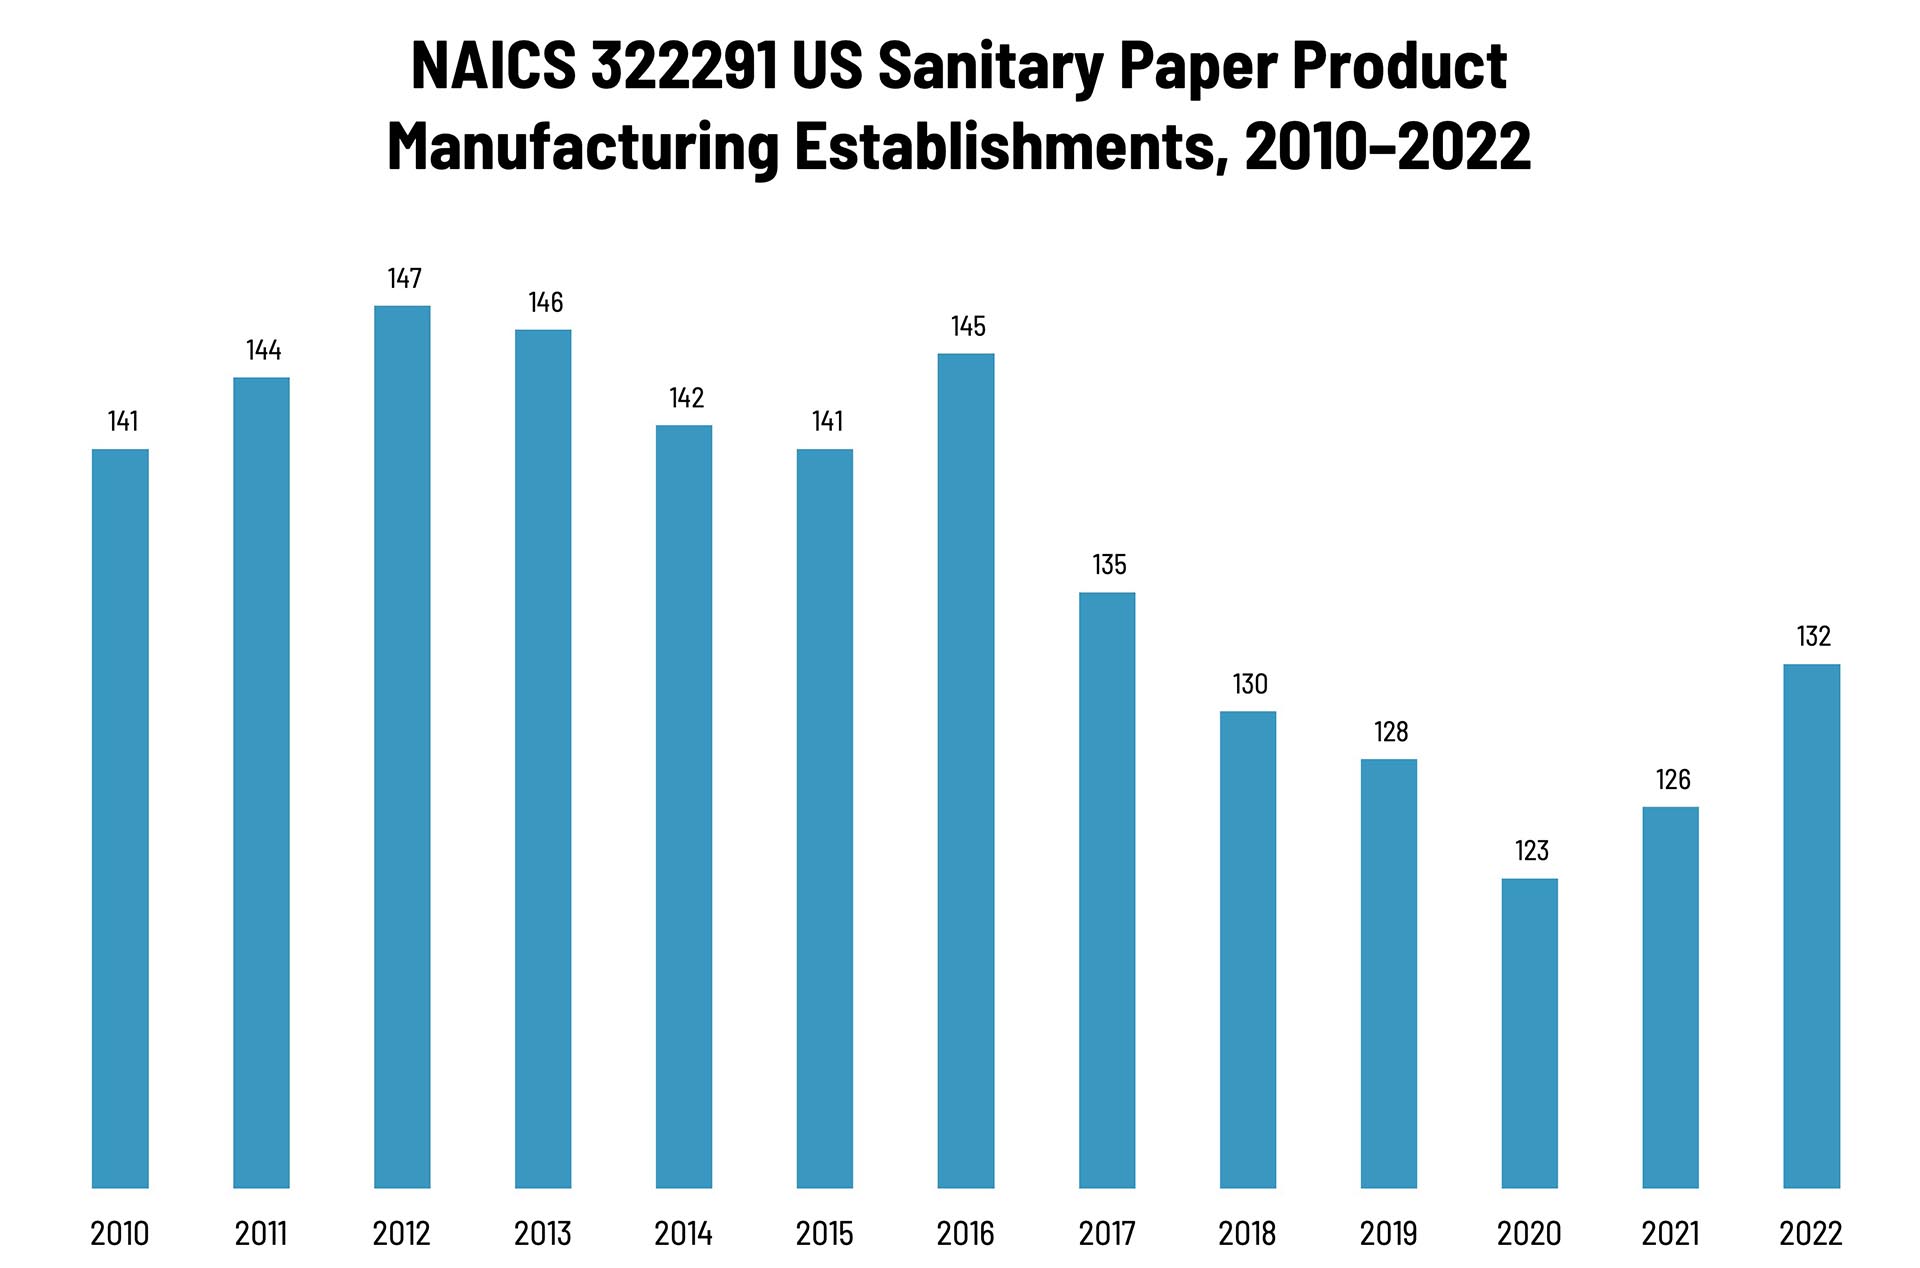
According to County Business Patterns, in 2022, there were 132 establishments in NAICS 322291 (Sanitary Paper Product Manufacturing). This NAICS category had been declining over the course of the 2010s, but since 2020 has seen an increase in establishments.
The Bureau of the Census definition for this business classification:
This U.S. industry comprises establishments primarily engaged in converting purchased sanitary paper stock or wadding into sanitary paper products, such as facial tissues, handkerchiefs, table napkins, toilet paper, towels, disposable diapers, sanitary napkins, and tampons.
Although the sanitary paper product market is a mature one, with few truly new products coming to market and few avenues for growth, it’s still not one to sneeze at. The market is dominated by a few very large manufacturers with little room for newcomers—and the establishment data reflect no small amount of consolidation.
Products are broadly divided into “consumer” and “commercial and industrial,” the latter of which is intended for schools, hospitals, or offices. Although the distinction is rarely important, in 2020, the inability of manufacturers to quickly pivot from the latter to the former led to the infamous toilet paper shortages during the pandemic lockdown.
These products tend to be “non-discretionary,” in that there is very little that will stimulate (or depress) usage/sales, save for a particularly bad cold/flu/allergy season (or a pandemic), perhaps. The adult incontinence product category is perhaps the most recent new product category, and this market depends on population demographics, which currently favor growth. A baby boom would favor growth at the other end of the incontinence spectrum. The industry also tends to be highly integrated, so the major companies that manufacture the raw materials also convert those into the final products.
Interestingly, there are now companies that produce on-demand customized, personalized diapers. As Mary Schilling pointed out in her recent Industrial Printing Technology Outlook:
As nonwoven materials become more print-friendly, inkjet systems are being used to decorate diapers with vibrant, character-driven designs. Some diaper liners are printed with pressure-activated ink that reveal a rhyme or animation when flexed, entertaining the baby (and the parents) mid-change.
But it doesn’t stop at aesthetics. Functional inks that respond to moisture or temperature are being trialed for real-time wetness indicators for both baby as well as adult diapers.
Small changes in these categories can have substantial environmental impacts—and sometimes for the better. UK supermarket chain Sainsbury reduced the width of a toilet paper roll by 11mm, allowing more rolls to be fit into a delivery van and eliminating 500 van trips a year—saving 140 tons of CO2 annually in reduced transport and materials.
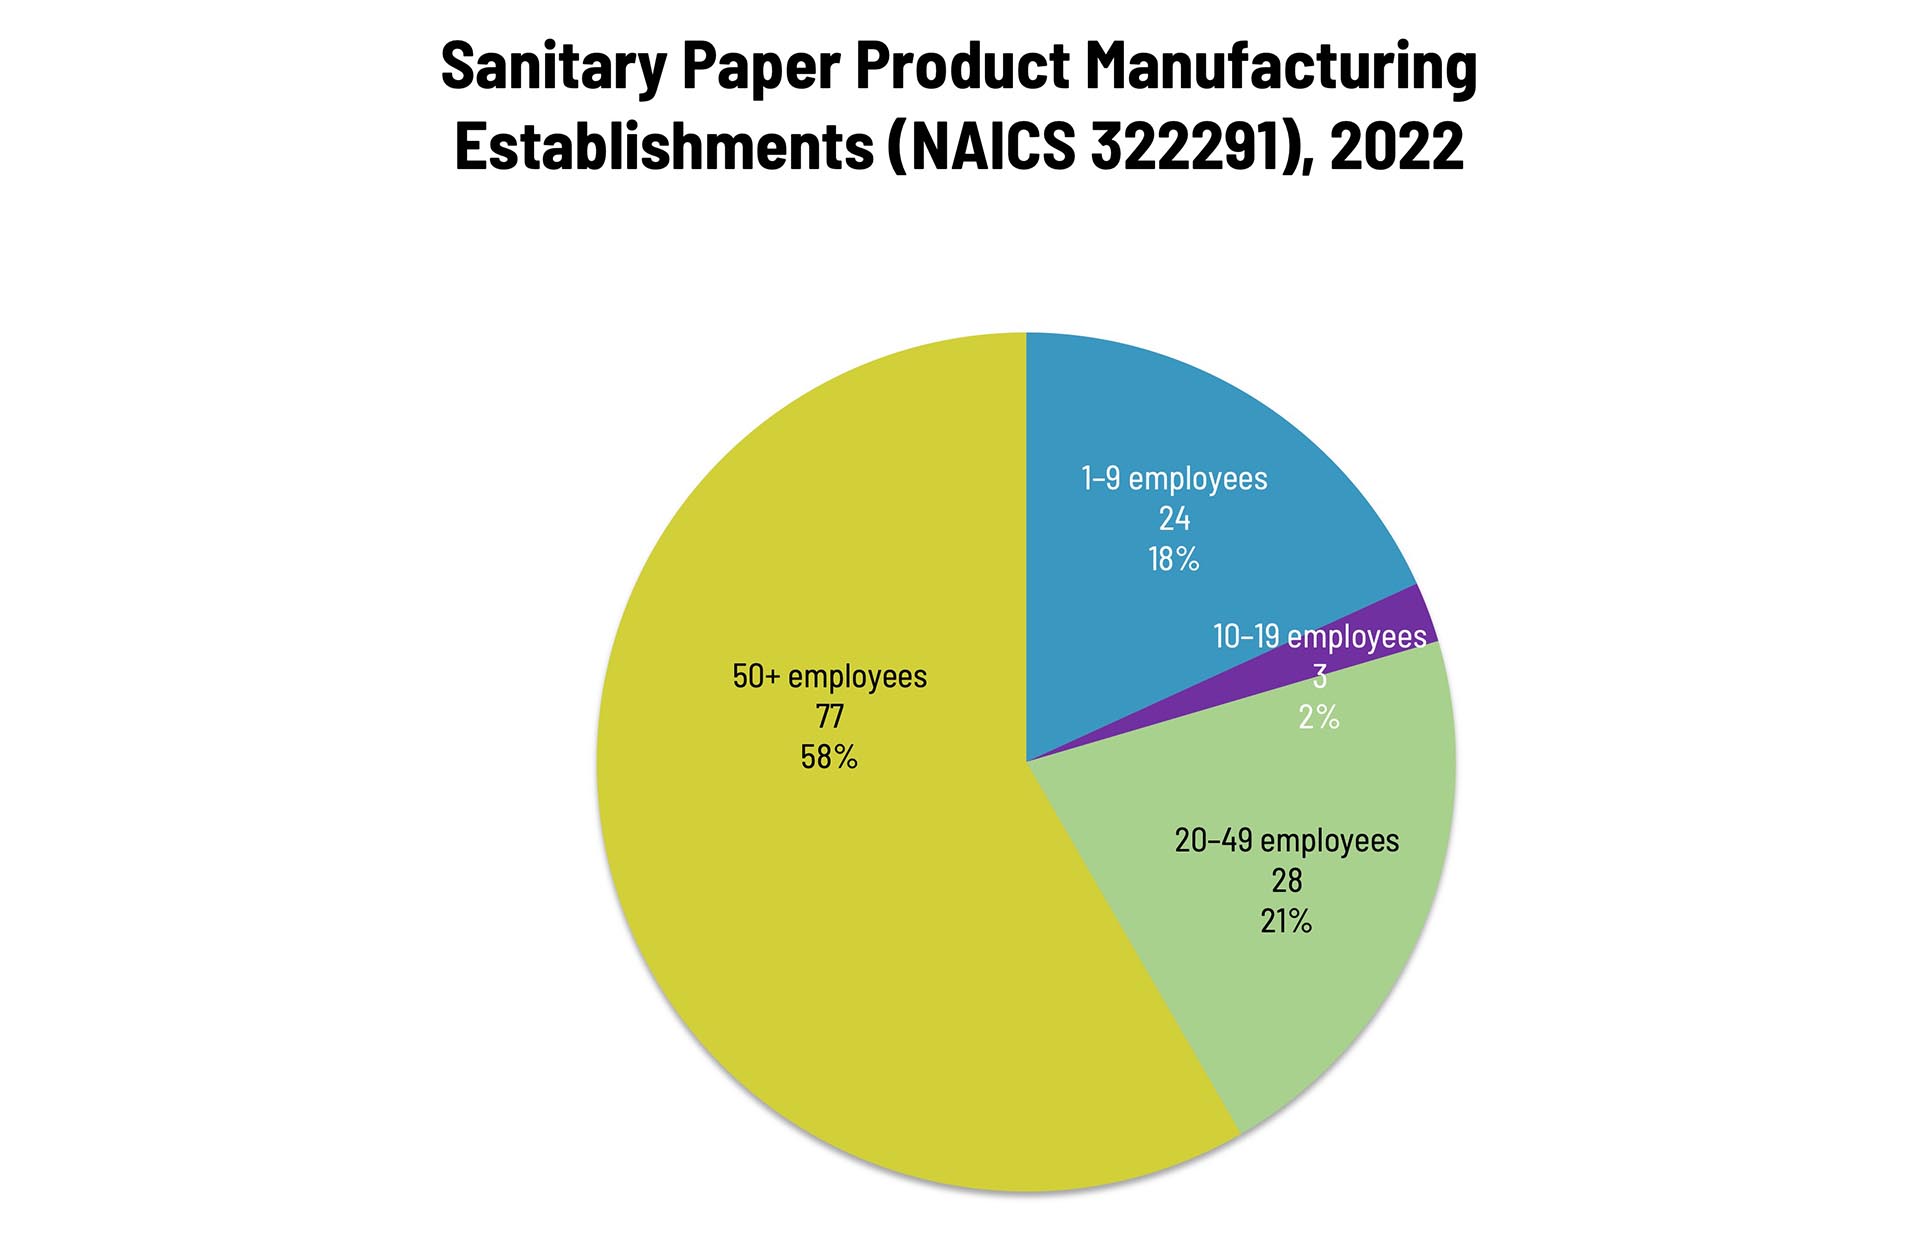
Establishments in this category are fairly concentrated at the large end. Small stationery product manufacturers (1 to 9 employees) account for 18% of all establishments, large manufacturers (50+ employees) account for 58% of establishments, and mid-size establishments (10–49 employees) account for 23%.
These counts are based on data from the Census Bureau’s County Business Patterns. Every other week, we update these data series with the latest figures. These counts are broken down by printing business classification (based on NAICS, the North American Industrial Classification System).
Next up, the last of the converting categories:
- 322299 All Other Converted Paper Product Manufacturing
To clarify what is included in the 2022 CBP, establishment counts represent the number of locations with paid employees at any time during the year. If an establishment existed at any point during the year, it would be included in the CBP count of the number of establishments for 2022 CBP.
These data, and the overarching year-to-year trends, like other demographic data, can be used not only for business planning and forecasting, but also sales and marketing resource allocation.
This Macro Moment…
One data point we check in with occasionally is the American Institute of Architects (AIA) Architecture Billings Index (ABI), which is a leading indicator for new commercial real estate investment and thus potential new signage projects. According to the AIA, in October 2025, demand for design services continued to decline:
The ABI score of 47.6 for October indicates that fewer firms reported declining billings this month than in September, when the score was 43.3. In addition, inquiries into new projects increased significantly this month, with the largest share of firms in a year and a half reporting an increase. On the other hand, the value of newly signed design contracts decreased yet again, as projects remain smaller and clients remain hesitant to commit.
The billings index hasn’t been above 50 since October 2024 (anything below 50 is poor). AIA/Deltek asked architecture firms about their revenue expectations for 2025 and their outlook for 2026:
On average, responding firm leaders expect their net revenue this year to decline by 1.2% compared to 2024. Nearly four in ten (38%) expect revenue to decline, versus nearly one third (32%) that expect revenue to increase, and 30% that expect it to remain about the same as last year.
When looking ahead to 2026, most firms project that their net revenue will be flat, declining just 0.9% on average. Firms located in the Northeast and small firms expect the largest decreases, of 3% and 8%, respectively. Large firms and firms with a multifamily residential specialization project very slight growth, of 0.5% and 0.6%, respectively.
The rule of thumb is that this index leads actual commercial real estate investment by about 9–12 months, so commercial real estate development might also be a bit soft as we head through 2025. Sign businesses should keep an eye on construction activity in their area to get a jump on involvement in these projects.


