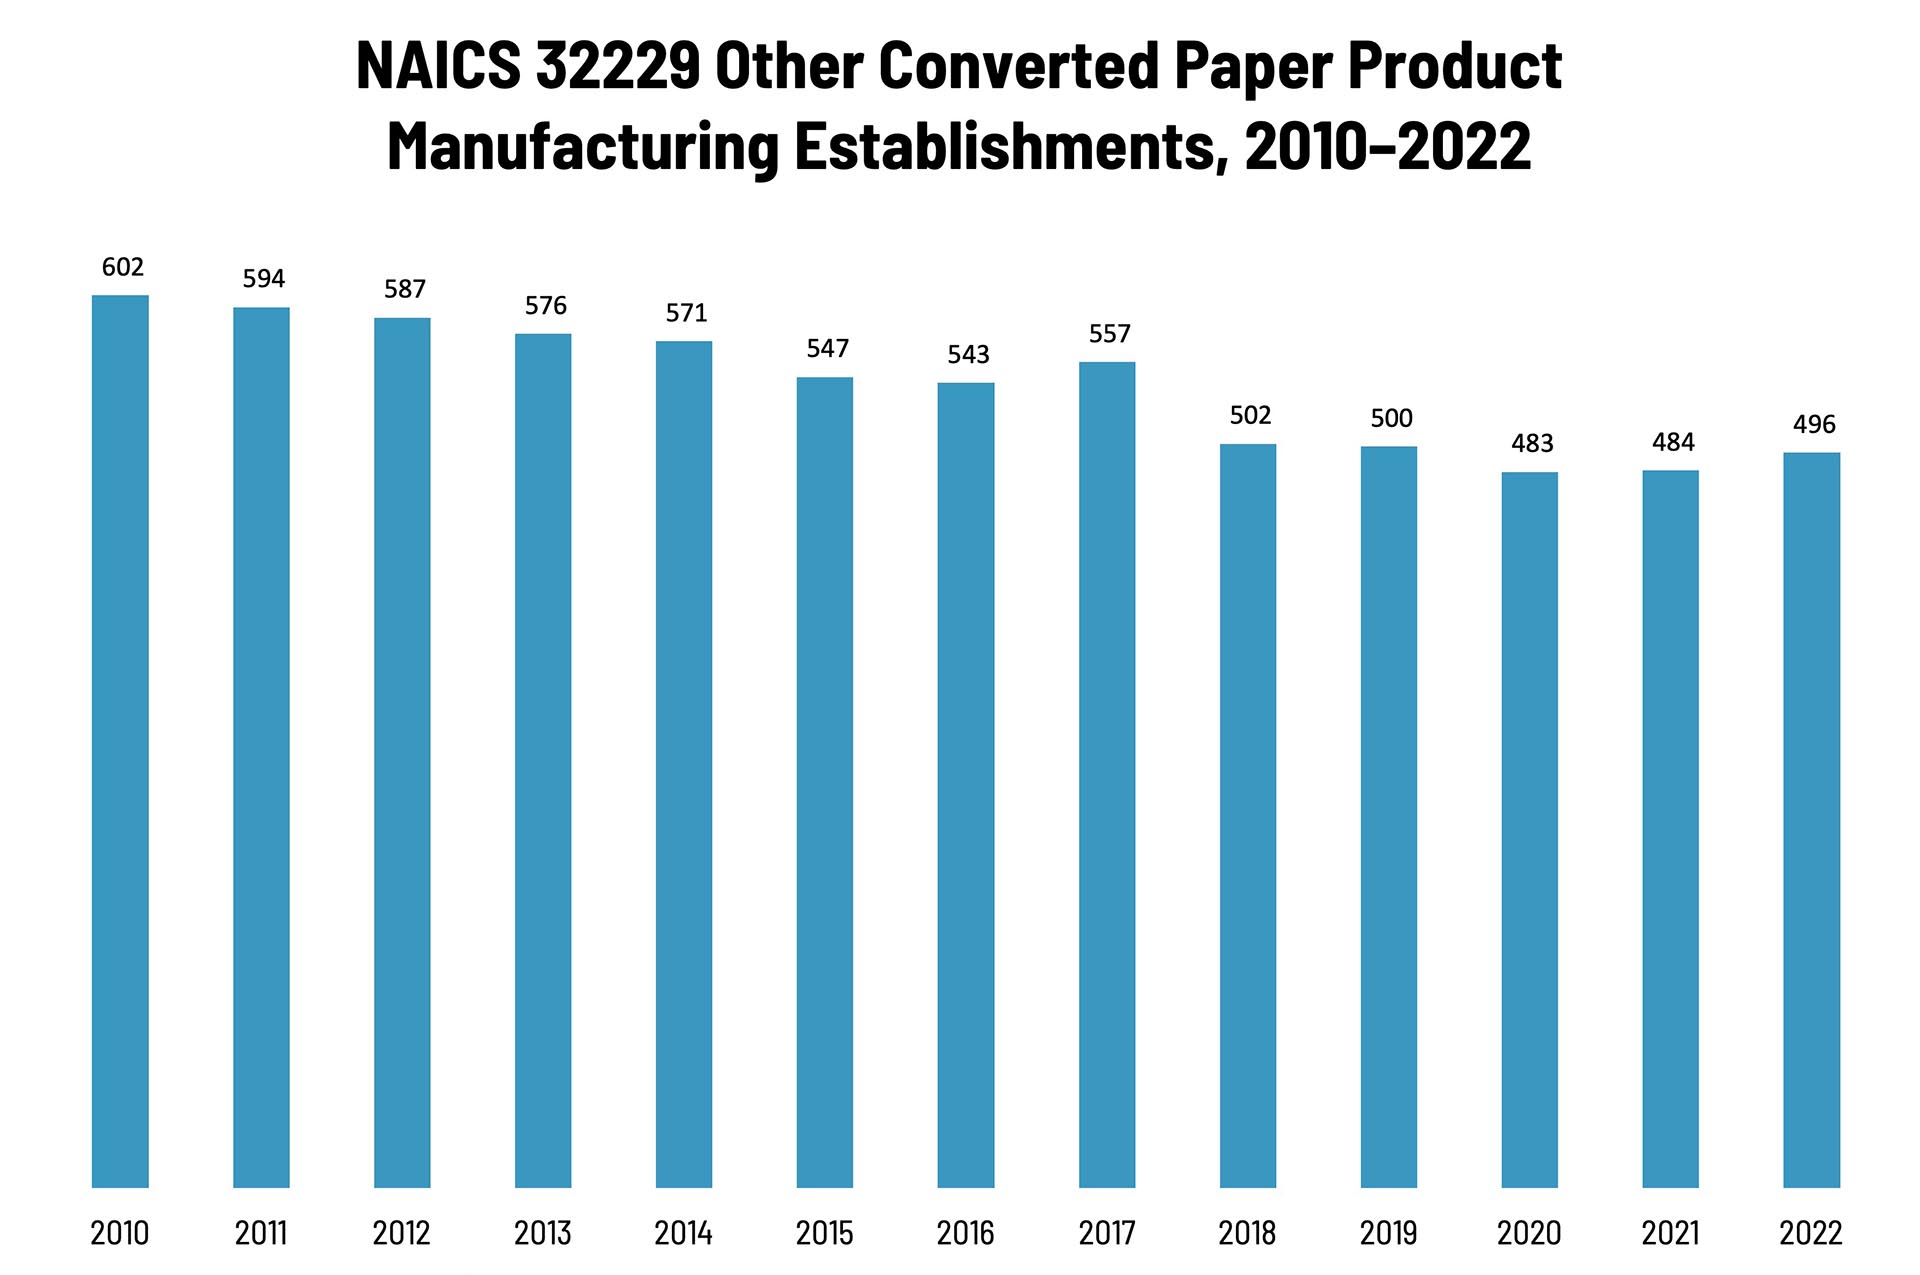
According to County Business Patterns, in 2022, there were 496 establishments in NAICS 32229 (Other Converted Paper Product Manufacturing). This NAICS category has declined steadily over the course of the decade, with a spike in establishments in 2017 and another in 2022.
The Bureau of the Census definition for this business classification:
This industry comprises establishments primarily engaged in (1) converting paper and paperboard into products (except containers, bags, coated and treated paper and paperboard, and stationery products) or (2) converting pulp into pulp products, such as disposable diapers, or molded pulp egg cartons, food trays, and dishes. Processes used include laminating or lining purchased paper or paperboard.
Since this product category largely comprises food trays, egg cartons, and a similar hodgepodge of food packaging-related products, trends in this packaging category will depend upon trends in the types of food they contain. For example, starting in 2018, egg consumption had been increasing and creative egg packaging was seen as an “uncracked market,” according to the American Egg Board (waka waka). Competition from foam-based food trays and cartons was and continues to be substantial, and while cushioning, cost-effectiveness, and moisture-impermeability work in foam’s favor, biodegradability/sustainability works in the favor of paper-based trays/cartons. At the time, there was also increased demand for food trays/packaging (take-out, restaurant leftovers, school and cafeteria use, etc., e.g.), but had been moving in foam’s direction. (There was a spike in home delivery/take-out during the lockdowns of 2020, and it looks like that momentum continued.) At the same time, the increasing number of municipal bans on foam takeout containers can work to paper’s advantage.
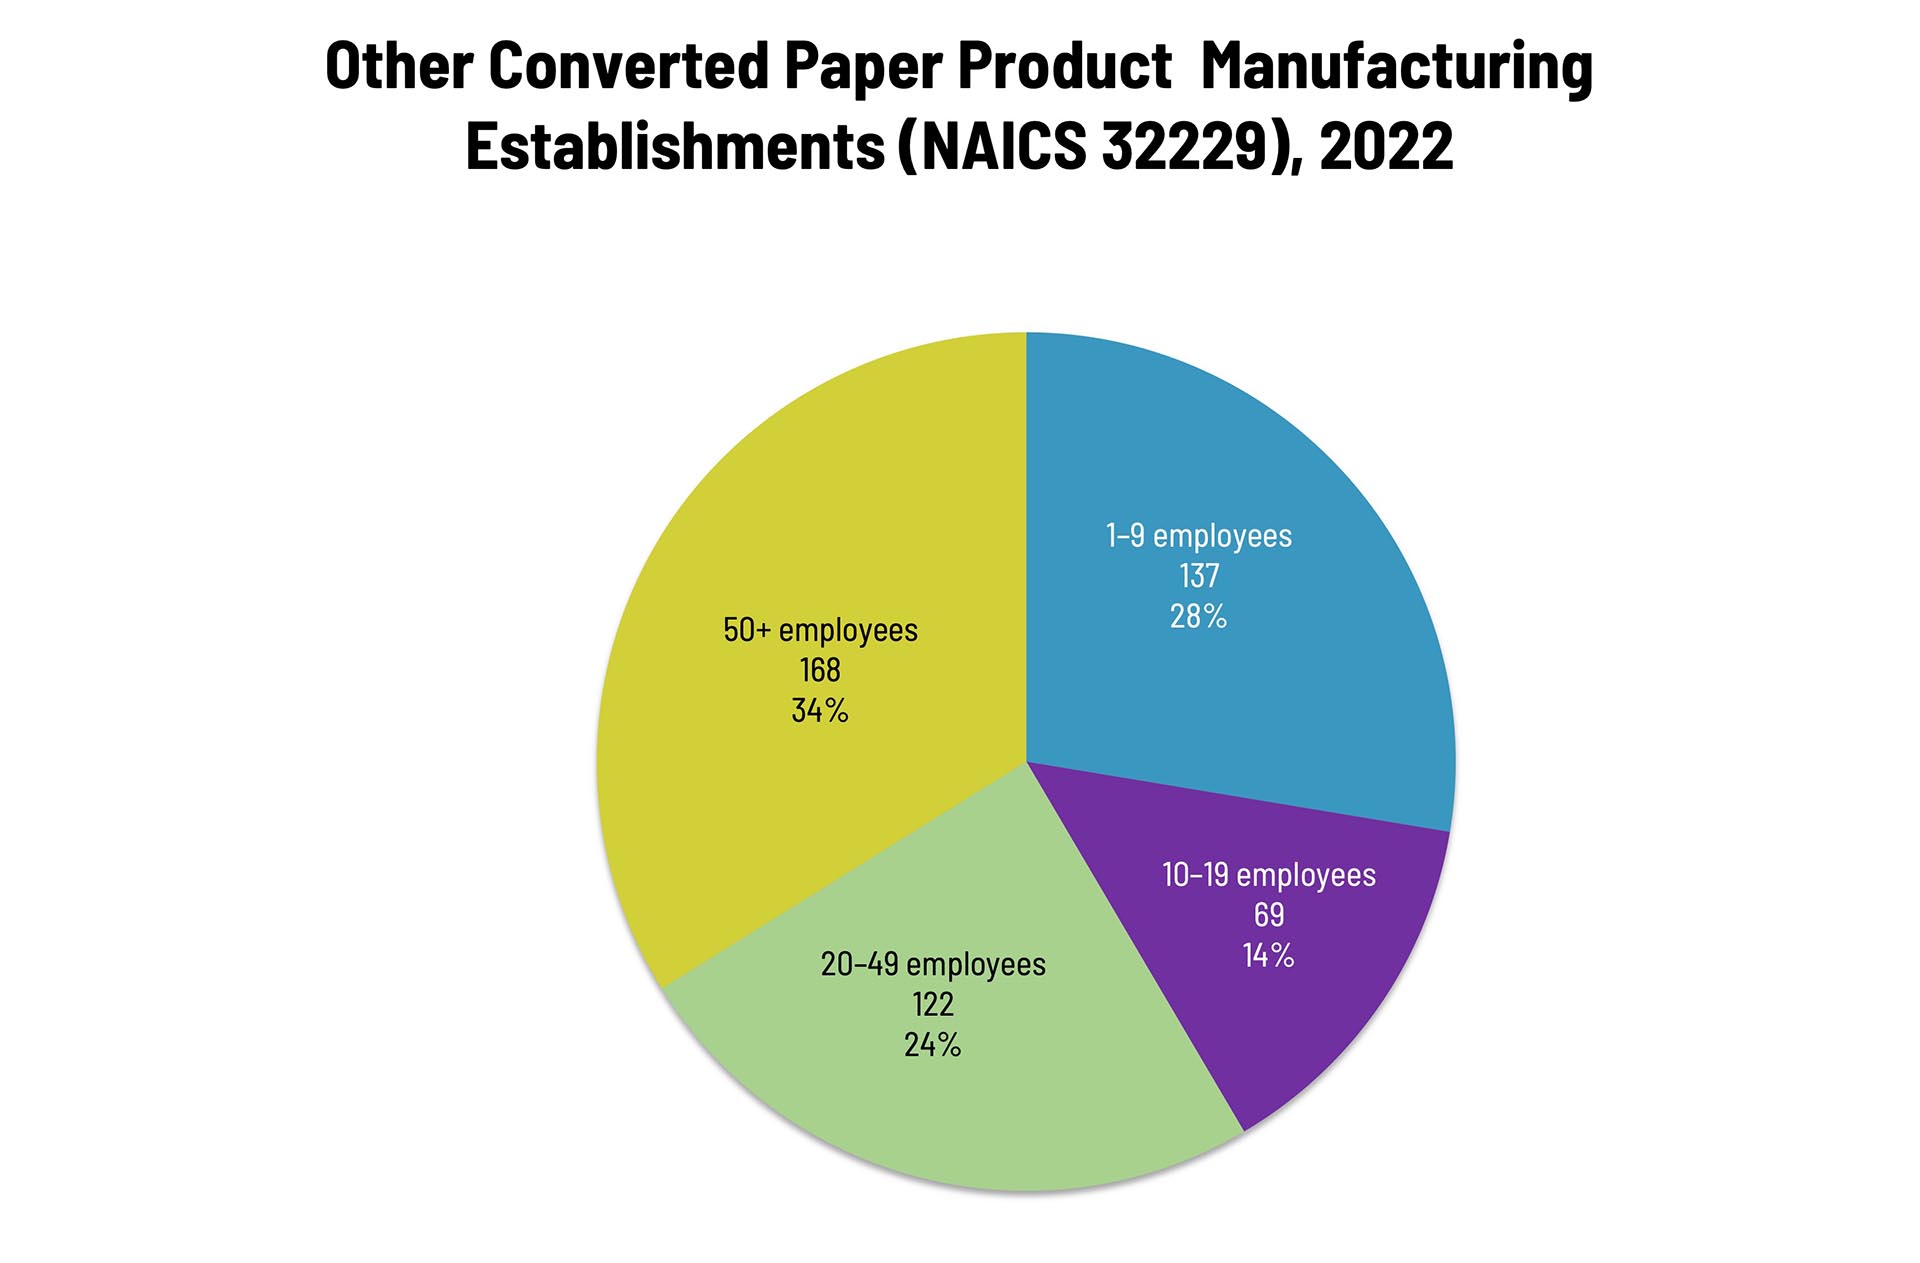
Establishments in this category are pretty evenly distributed. Small converted paper manufacturers (1 to 9 employees) account for 28% of all establishments, large manufacturers (50+ employees) account for 34% of establishments, and mid-size establishments (10–49 employees) account for 38%.
These counts are based on data from the Census Bureau’s County Business Patterns. Every other week, we update these data series with the latest figures. These counts are broken down by printing business classification (based on NAICS, the North American Industrial Classification System).
Next up, we’ll continue through the converting NAICS categories:
- 322291 Sanitary Paper Product Manufacturing
- 322299 All Other Converted Paper Product Manufacturing
To clarify what is included in the 2022 CBP, establishment counts represent the number of locations with paid employees at any time during the year. If an establishment existed at any point during the year, it would be included in the CBP count of the number of establishments for 2022 CBP.
These data, and the overarching year-to-year trends, like other demographic data, can be used not only for business planning and forecasting, but also sales and marketing resource allocation.
This Macro Moment…
Uh, let’s see…there’s not a lot to choose from, thanks to the shutdown, but ADP (Automatic Data Processing) releases a regular jobs report that economists and labor market experts analyze in conjunction with the Bureau of Labor Statistics (BLS) jobs report numbers. So, according to the ADP National Employment report:
Private sector employment increased by 42,000 jobs in October and pay was up 4.5 percent year-over-year according to the October ADP National Employment Report® produced by ADP Research in collaboration with the Stanford Digital Economy Lab (“Stanford Lab”).
The consensus had been that job growth in October would be 25,000, which the non-forthcoming BLS data would confirm or refute.
It is worth pointing out that whilst the ADP jobs data is useful, it does have its limitations. We’re not doing to go into too much detail here, but Pew Research and the St. Louis Fed have some useful explainers if you want to get into the weeds
ADP processes payrolls for more than 500,000 U.S. employers, which includes about 26 million employees—which works out to about one-fifth of the country’s private sector workforce. That last point is important: “private sector workforce,” which, ergo, does not include government employees. ADP also only includes their own client base, which tends to skew toward mid-size businesses. Still, ADP data is robust enough that the Federal Reserve has used it. And history has found that the ADP and BLS data sets are highly correlated, but there have been some dramatic divergences, such as earlier this year. Says CNBC:
Official labor numbers from the U.S. Bureau of Labor Statistics showed a higher-than-expected increase of147,000 jobs in June. The ADP report, released Wednesday, pointed to a decrease of 33,000 private sector jobs.
That’s not just a difference in magnitude, but also of direction. Emphasizing this point, the unemployment rate in June fell to 4.1% from 4.2% in the month before, defying a forecast for an increase to 4.3%.
The reason for the discrepancy? Government jobs, which had risen by 73,000 in June, comprising about half of the total nonfarm payroll growth for the month. BLS captures this, ADP does not. That’s not necessarily a flaw in the ADP data, but just the nature of the beast.
At any rate, the BLS data was widely believed to be the gold standard for employment data, and hopefully—once the government shutdown ends—that will remain the case.


