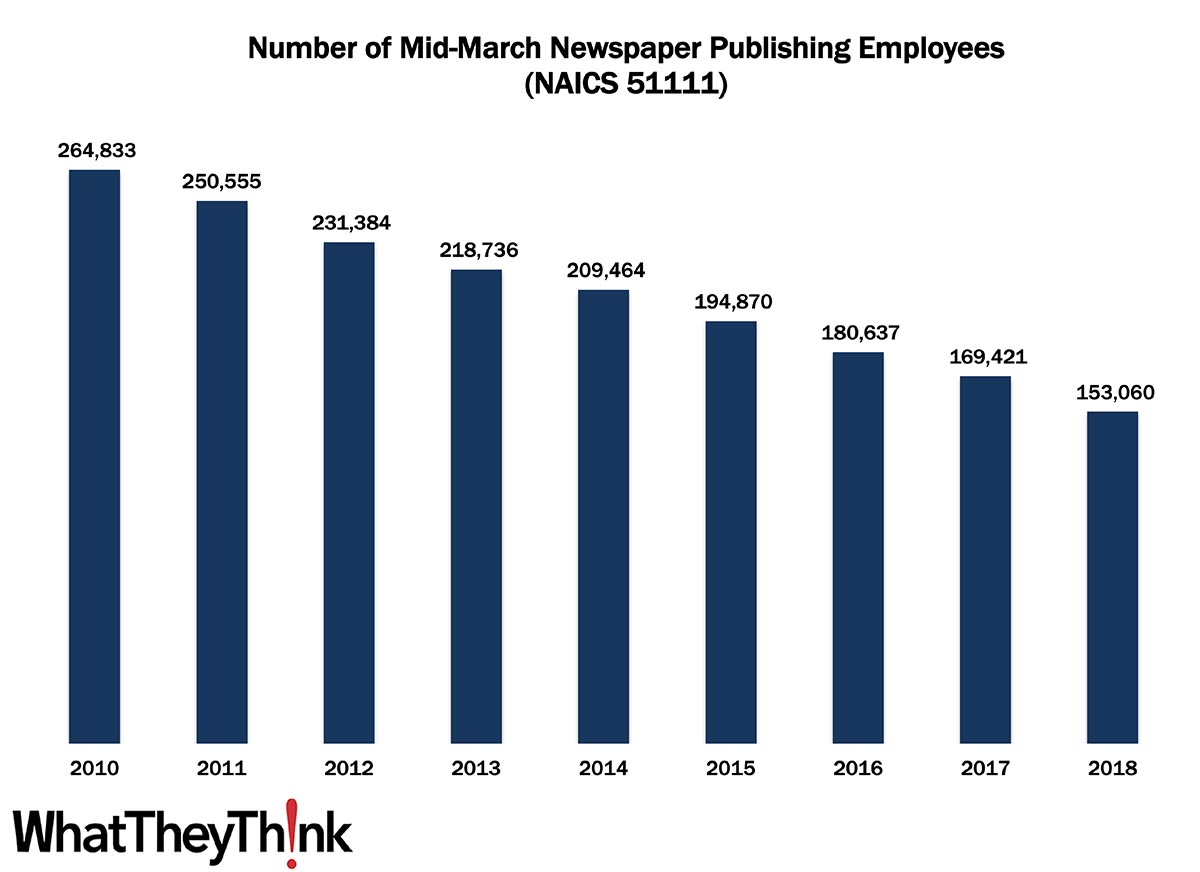
In 2010, there were 264,833 employees in U.S. newspaper publishing establishments, a count which steadily declined over the decade to 153,060 in 2018, which gibes with what we saw with establishments. AS we remarked then, it’s tempting to blame the Internet on the decline of newspaper circulation (and thus newspapers and even more thus newspaper publishers), but that really only hastened a trend that started with the advent of television and the nightly news and then by the advent of 24-hour cable news. At the same time, there has been tremendous consolidation among newspaper publishers, with one company owning many local papers, and even centralizing editorial and production facilities. The hardest hit have been small, local papers, which has serious consequences for local journalism.
These counts are based on data from the Census Bureau’s County Business Patterns. Every other week, we update these data series with the latest figures. These counts are broken down by printing business classification (based on NAICS, the North American Industrial Classification System). We will continue to look at employment in the publishing categories:
- 51112 Periodical Publishers
- 51113 Book Publishers
- 51114 Directory and Mailing List Publishers
- 51119 Other Publishers
- 511191 Greeting Card Publishers
- 511199 All Other Publishers
For some of these categories, we will also supplement County Business Patterns data with Nonemployer Statistics, which counts freelancers.
These data, and the overarching year-to-year trends, like other demographic data, can be used not only for business planning and forecasting, but also sales and marketing resource allocation.
This Macro Moment
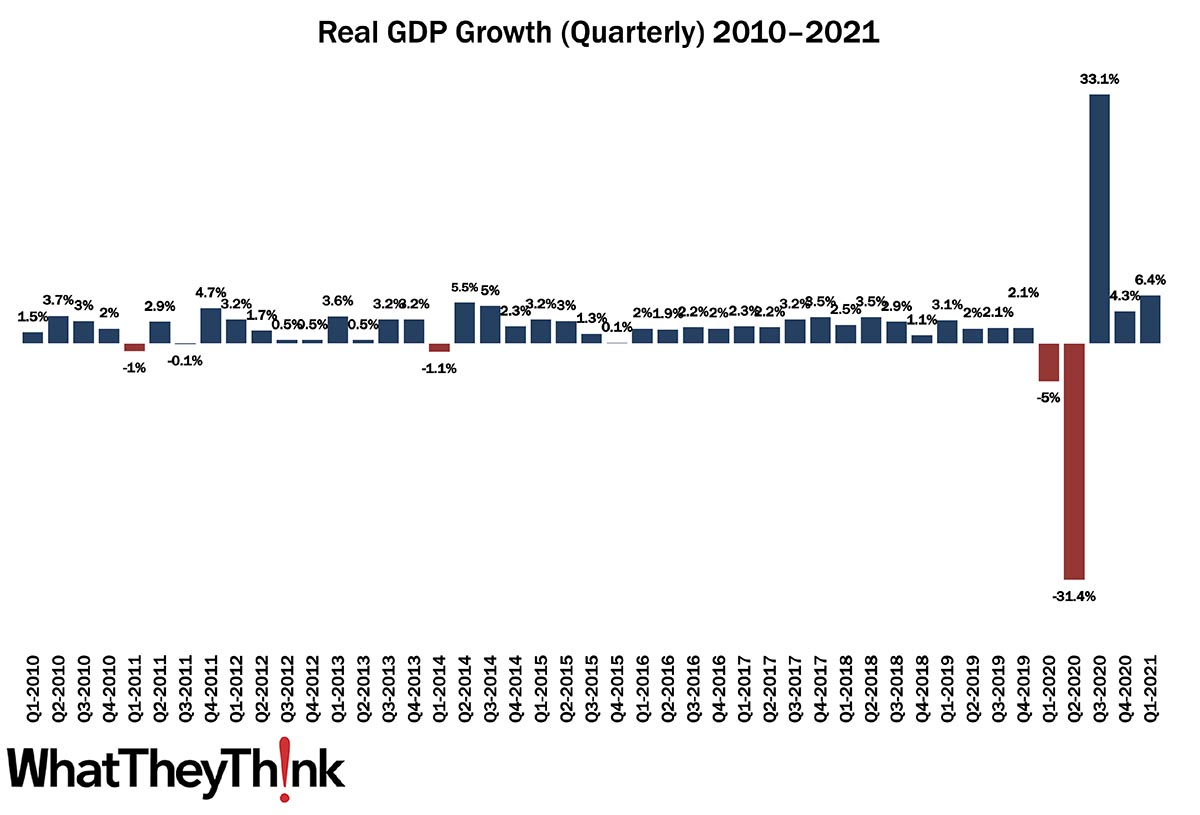
In some good news, the Bureau of Economic Analysis released their advance estimate of Q1 GDP and it came in at an annual rate of 6.4%.
The increase in real GDP in the first quarter reflected increases in personal consumption expenditures (PCE), nonresidential fixed investment, federal government spending, residential fixed investment, and state and local government spending that were partly offset by decreases in private inventory investment and exports. Imports, which are a subtraction in the calculation of GDP, increased.
And the increases in PCE were due in part to the American Rescue Plan Act. Admittedly, the 6.4% was below expectations, largely thanks to a decline in private inventories.
In terms of personal income:
Current-dollar personal income increased $2.40 trillion in the first quarter, or 59.0 percent, compared with a decrease of $351.4 billion, or 6.9 percent, in the fourth quarter.
Disposable personal income increased $2.36 trillion, or 67.0 percent, in the first quarter, compared with a decrease of $402.1 billion, or 8.8 percent, in the fourth quarter. Real disposable personal income increased 61.3 percent, compared with a decrease of 10.1 percent.
These numbers will continue to be revised and the second estimate of Q1 GDP will be released on May 27.


