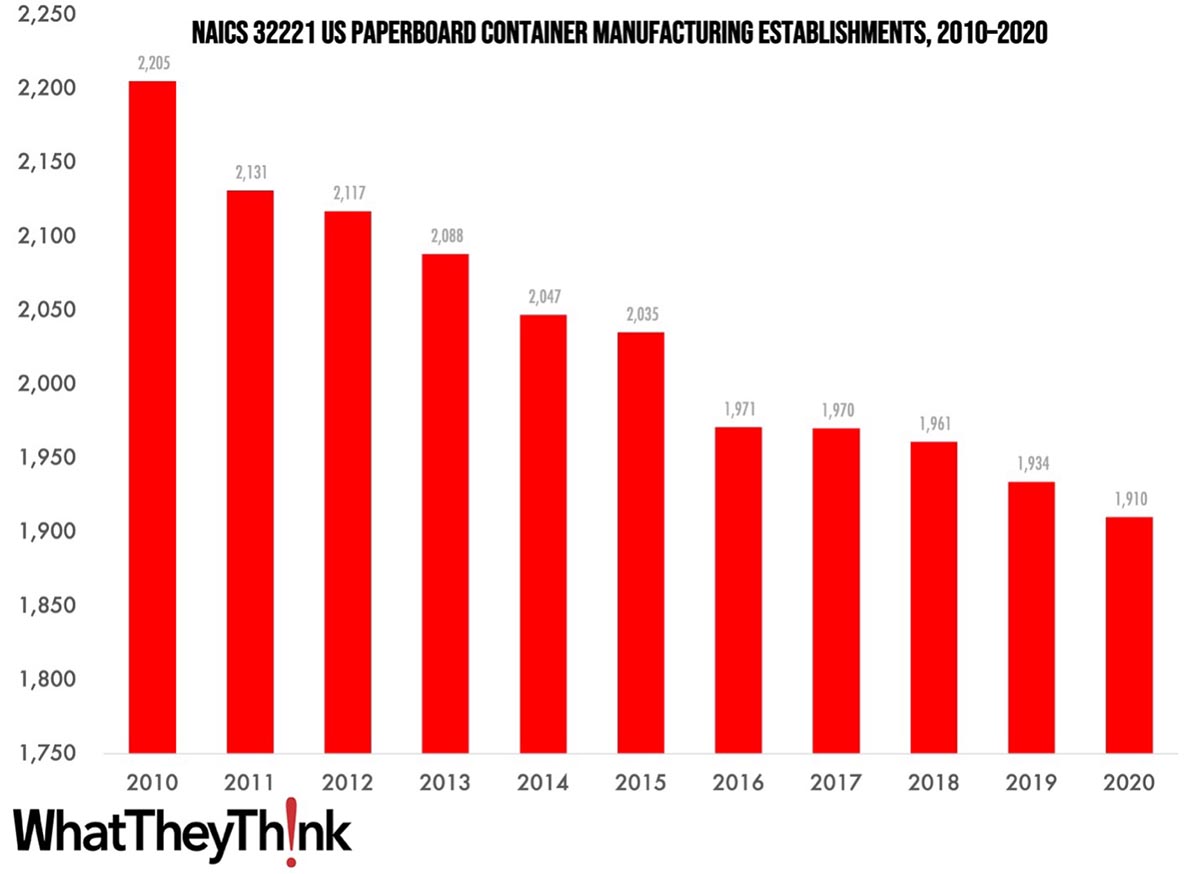
Our Friday data slice’n’dice look at the latest edition of County Business Patterns now turns to the converting industries. As 2020 began, there were 1,910 establishments in NAICS 32221 (Paperboard Container Manufacturing). This category saw a net decrease of 13% since 2010.
The Bureau of the Census definition for this business classification:
This industry comprises establishments primarily engaged in converting paperboard into containers without manufacturing paperboard. These establishments use corrugating, cutting, and shaping machinery to form paperboard into containers. Products made by these establishments include boxes, corrugated sheets, pads, pallets, paper dishes, and fiber drums and reels.
In this category, software prototyping of packaging such as boxes results in innovative designs, which can optimize the logistics of transporting packages, especially from overseas manufacturers. This has only accelerated since, but environmental concerns are becoming more important in box conversion. These data predate the COVID pandemic, but even in the mid-2010s, ecommerce has been driving demand for more and newer types of corrugated boxes. At the same time, we have also seen a not inconsiderable amount of consolidation in this sector.
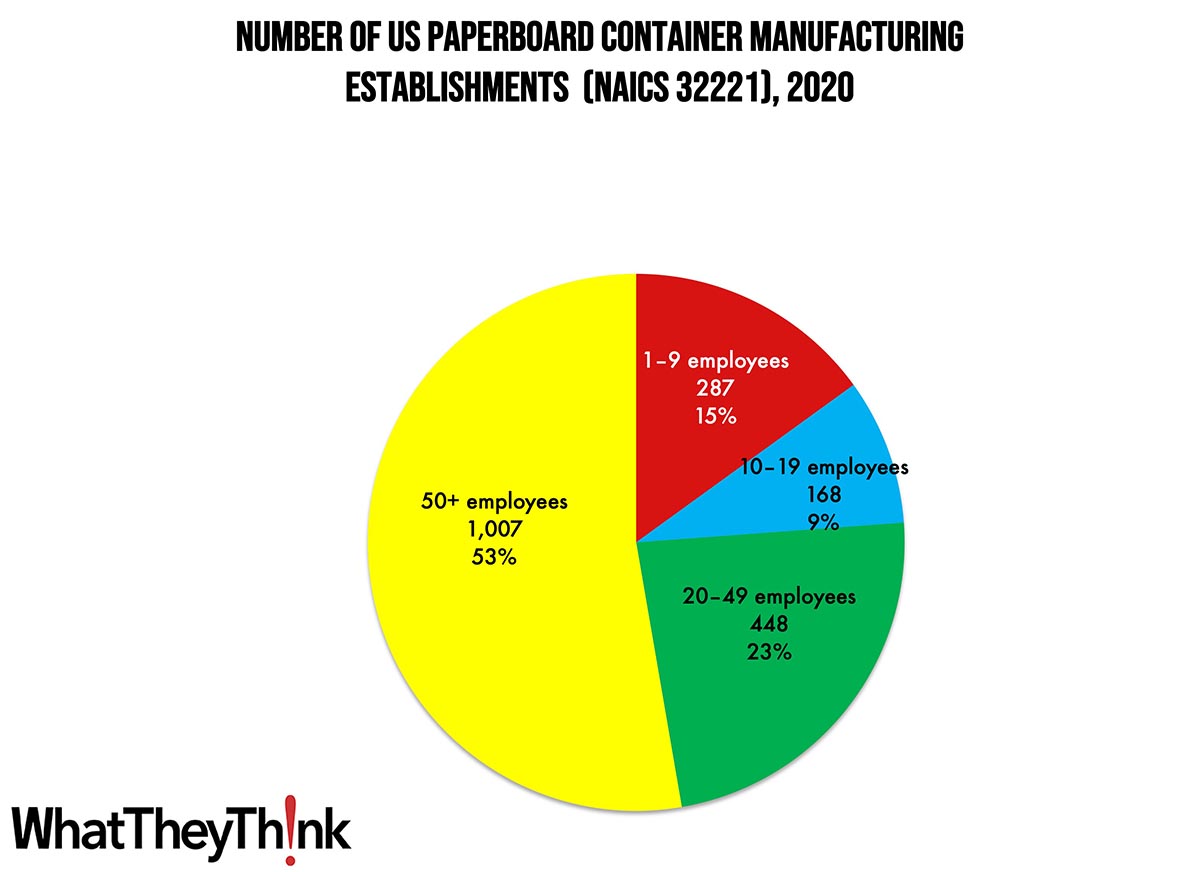
Establishments in this category are larger than we have seen in the printing and publishing industries. Small paperboard manufacturers (1 to 9 employees) account for only 15% of all establishments, while large manufacturers (50+ employees) account for just about half (53%).
These counts are based on data from the Census Bureau’s County Business Patterns. Every other week, we update these data series with the latest figures. These counts are broken down by printing business classification (based on NAICS, the North American Industrial Classification System).
Next up, we’ll continue through the converting NAICS categories:
- 322211 Corrugated and Solid Fiber Box Manufacturing
- 322212 Folding Paperboard Box Manufacturing
- 322219 Other Paperboard Container Manufacturing
- 32222 Paper Bag and Coated and Treated Paper Manufacturing
- 32223 Stationery Product Manufacturing
- 32229 Other Converted Paper Product Manufacturing
- 322291 Sanitary Paper Product Manufacturing
- 322299 All Other Converted Paper Product Manufacturing
To clarify what is included in the 2020 CBP, establishment counts represent the number of locations with paid employees at any time during the year. If an establishment existed at any point during the year, it would be included in the CBP count of the number of establishments for 2020 CBP. Thus, businesses lost during the COVID pandemic won’t be accounted for until the 2021 CBP.
These data, and the overarching year-to-year trends, like other demographic data, can be used not only for business planning and forecasting, but also sales and marketing resource allocation.
This Macro Moment…
The BLS released its latest inflation figures this week and it’s not terrible:
The Consumer Price Index for All Urban Consumers (CPI-U) rose 0.4 percent in February on a seasonally adjusted basis, after increasing 0.5 percent in January, the U.S. Bureau of Labor Statistics reported today. Over the last 12 months, the all items index increased 6.0 percent before seasonal adjustment.
However:
The index for shelter was the largest contributor to the monthly all items increase, accounting for over 70 percent of the increase, with the indexes for food, recreation, and household furnishings and operations also contributing. The food index increased 0.4 percent over the month with the food at home index rising 0.3 percent. The energy index decreased 0.6 percent over the month as the natural gas and fuel oil indexes both declined.
Calculated Risk digs into the Cleveland Fed’s complementary inflation measures:
According to the Federal Reserve Bank of Cleveland, the median Consumer Price Index rose 0.6% in February. The 16% trimmed-mean Consumer Price Index increased 0.5% in February. “The median CPI and 16% trimmed-mean CPI are measures of core inflation calculated by the Federal Reserve Bank of Cleveland based on data released in the Bureau of Labor Statistics’ (BLS) monthly CPI report”.
Some other points of interest:
On a year-over-year basis, the median CPI rose 7.2%, the trimmed-mean CPI rose 6.5%, and the CPI less food and energy rose 5.5%. Core PCE is for January and increased 4.7% year-over-year.
Note: The Cleveland Fed released the median CPI details. "Fuel oil and other fuels" decreased at a 55% annualized rate in February, and "Used Cars" decreased at a 29% annualized rate.
Note that Owners' Equivalent Rent and Rent of Primary Residence account for 1/3 of median CPI, and these measures were up 8.8% annualized (based on relative importance in the index). This data is lagged and asking rents have declined in recent months (due to the sharp slowdown in household formation). Ex-Shelter these indexes are decreasing sharply.


