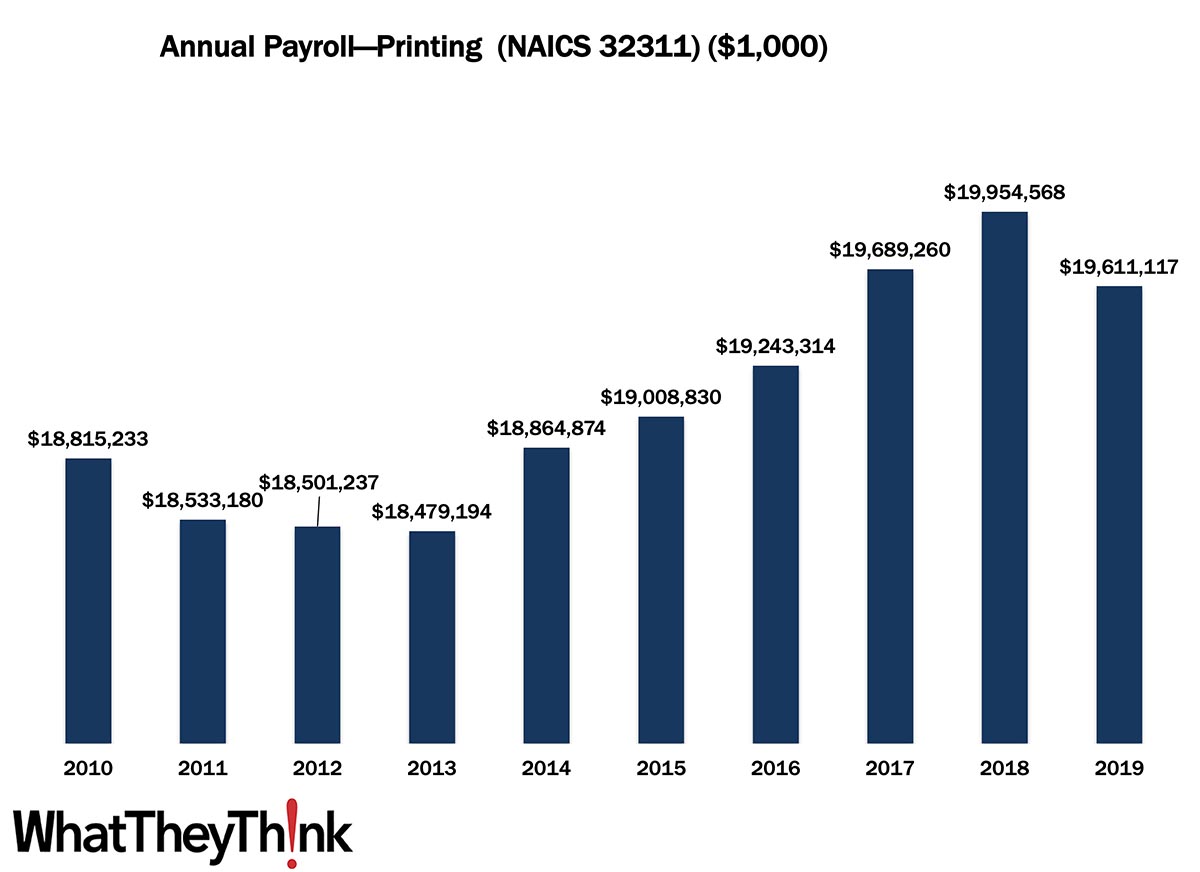
We continue our look at annual payroll in the printing industry.
Last time, we looked at NAICS 323 (Printing and related support activities), and this week, we drill a bit deeper to look at NAICS 32311 (Printing), which backs out “support activities” (prepress and postpress). In 2010, US establishments in NAICS 32311 had an annual payroll of $18.8 billion. Payrolls dipped during and in the aftermath of the Great Recession, but rose, at least on a current dollar basis, over the latter half of the decade, coming in at $19.6 billion in 2019. Note that County Business Patterns payroll data are reported in current, not inflation-adjusted, dollars. If we were to adjust for inflation, 2010 payroll would be equivalent to $21.9 billion in 2019, so we are essentially looking at an overall decline of -11% in payroll over the course of the decade. Now, this is not just due to inflation—employment and establishments had also declined by 13% and 15%, respectively, over that same time period.
At least in the time period we are looking at here, the decline in industry employment is due to a number of factors. Industry consolidation and the fallout from the Great Recession, especially in the early part of the decade, played a large part and while the hot topic today is the scarcity of finding employees, that had been the case even pre-pandemic. So these declines in employees and thus payroll are to an extent due to retirement and workers otherwise exiting the industry without a ready pool of next-generation employees waiting to be hired—a situation only magnified in 2022.
These counts are based on data from the Census Bureau’s County Business Patterns. Every other week, we update these data series with the latest figures. Census Bureau reports include other data, as well, such as number of employees, payroll, etc. These counts are broken down by publishing business classification (based on NAICS, the North American Industrial Classification System). Over the next few months, we will be looking at:
- 323111 (Commercial Printing, except Screen and Books)
- 323113 (Commercial Screen Printing)
- 323117 (Books Printing)
- 32312 (Support Activities for Printing—aka prepress and postpress services)
These data, and the overarching year-to-year trends, like other demographic data, can be used not only for business planning and forecasting, but also sales and marketing resource allocation.
This Macro Moment
Expectations for Q1 2022 GDP growth had not been especially high, but no one expected a decline. Said the BEA yesterday:
Real gross domestic product (GDP) decreased at an annual rate of 1.4 percent in the first quarter of 2022, according to the "advance" estimate released by the Bureau of Economic Analysis. In the fourth quarter, real GDP increased 6.9 percent.
The decrease in real GDP reflected decreases in private inventory investment, exports, federal government spending, and state and local government spending, while imports, which are a subtraction in the calculation of GDP, increased. Personal consumption expenditures (PCE), nonresidential fixed investment, and residential fixed investment increased).
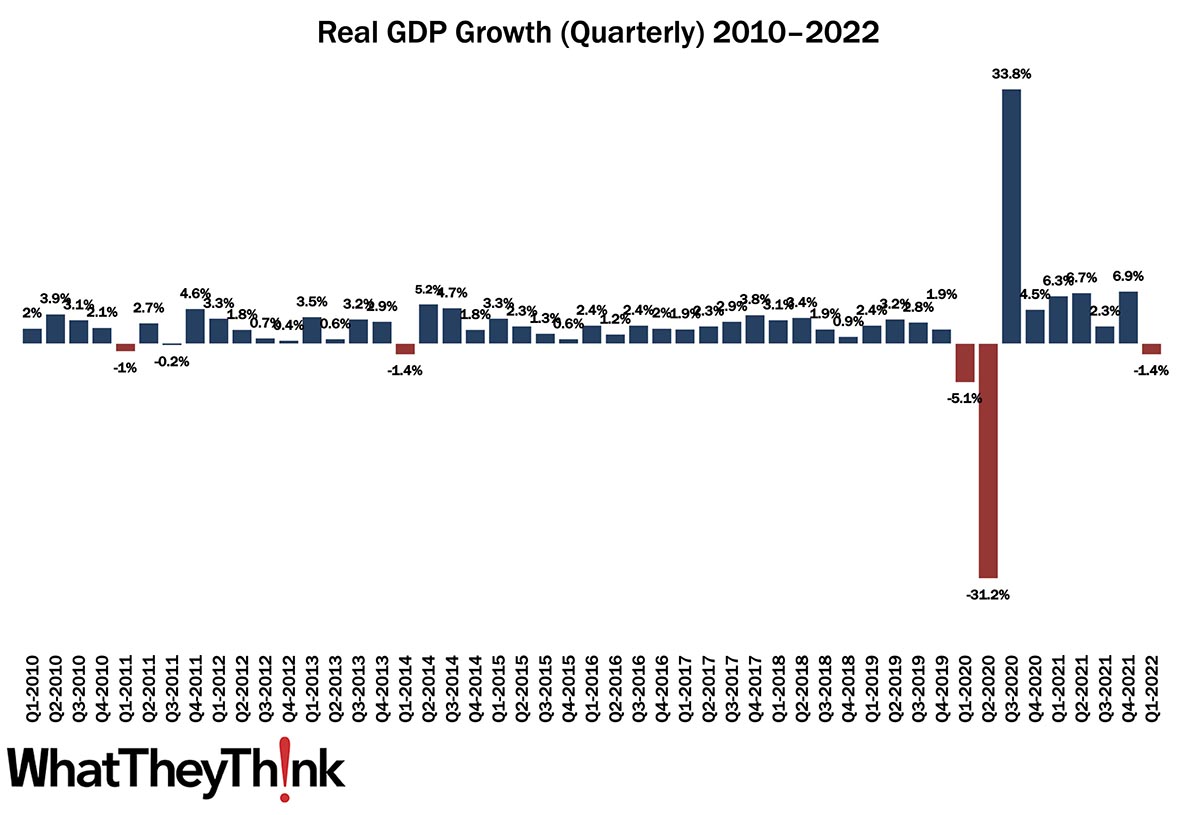
Source: Bureau of Economic Analysis
As the BEA said, the decline was mostly due to slower growth in inventories, as there had been a surge at the end of 2021 to stave off “supply chain” disruptions, as well as international trade. Exports were down due in part to the Ukraine war, while imports were up as, again, US businesses spent heavily on imports to stave off “supply chain” disruptions. (We saw a record high trade deficit in March.). And lower government spending also slowed growth. On the plus side, consumer spending grew +0.7% and business investment was strong.
There were no changes to Q4 2021’s +6.9% GDP growth.


