We are starting a new data series in our Friday Data Slice’n’Dice, again based on data from County Business Patterns: annual payroll.
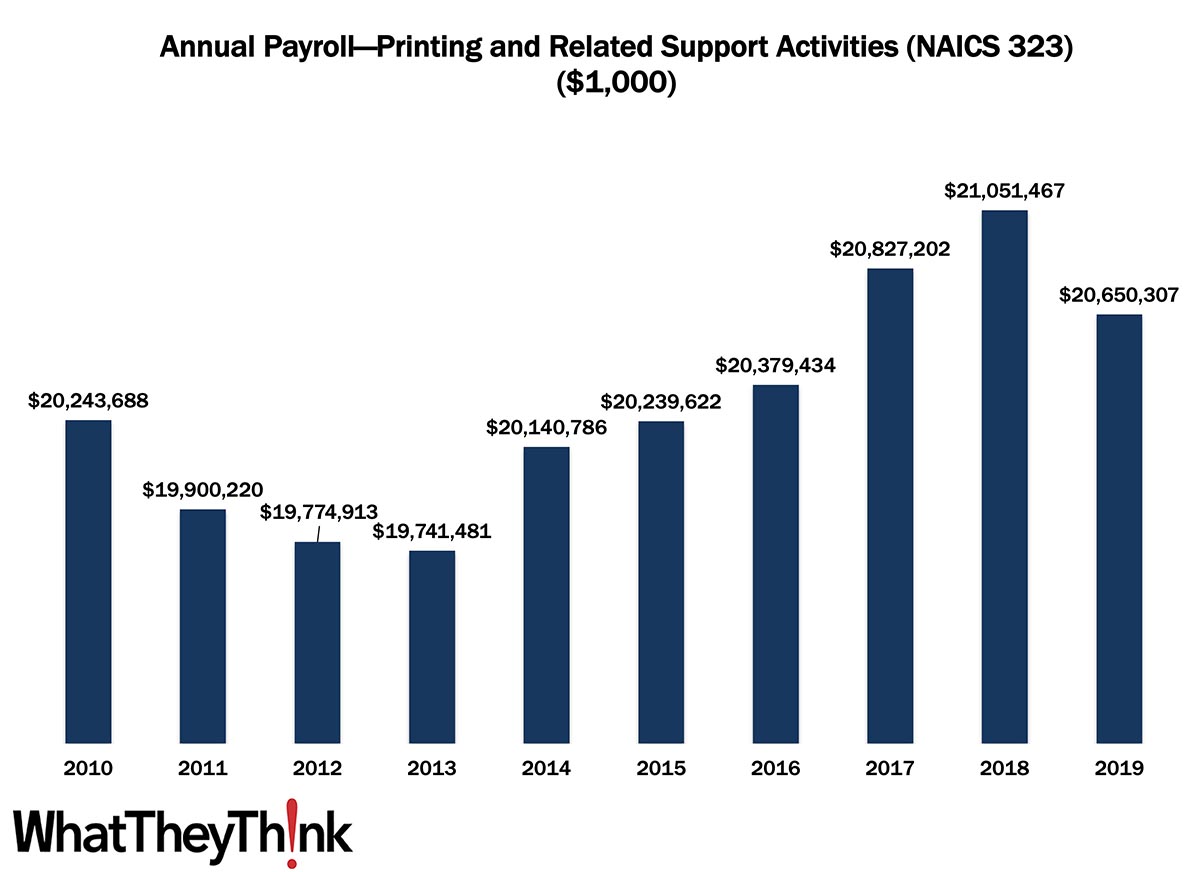
We start at the very beginning with our old friend NAICS 323 (Printing and related support activities). In 2010, US establishments in NAICS 323 had an annual payroll of $20.2 billion. Payrolls dipped during and in the aftermath of the Great Recession. They rose, at least on a current dollar basis, over the latter half of the decade, coming in at $20.7 billion in 2019. Note that County Business Patterns payroll data are reported in current not inflation-adjusted dollars. If we were to adjust for inflation, 2010 payroll would be equivalent to $23.7 billion in 2019, so we are essentially looking at an overall decline of -13% in payroll over the course of the decade. Now, this is not just due to inflation—employment had declined by 14.1% over that same time period and establishments by 16.9%.
At least in the time period we are looking at here, the decline in industry employment is due to a number of factors:
Industry consolidation and the fallout from the Great Recession, especially in the early part of the decade, played a large part and while the hot topic today is the scarcity of finding employees, that had been the case even pre-pandemic. So these declines in employees and thus payroll are to an extent due to retirement and workers otherwise exiting the industry without a ready pool of next-generation employees waiting to be hired—a situation only magnified in 2022.
It’s also interesting that the automation trend runs in an opposite direction in our industry than in other industries. Usually, automation displaces current employees, such as in various kinds of industrial manufacturing businesses. In the printing industry, automation is increasingly being looked to as a solution to employees who have already been self-displaced.
These counts are based on data from the Census Bureau’s County Business Patterns. Every other week, we update these data series with the latest figures. Census Bureau reports include other data, as well, such as number of employees, payroll, etc. These counts are broken down by publishing business classification (based on NAICS, the North American Industrial Classification System). Over the next few months, we will be looking at:
- 32311 (Printing)
- 323111 (Commercial Printing, except Screen and Books)
- 323113 (Commercial Screen Printing)
- 323117 (Books Printing)
- 32312 (Support Activities for Printing—aka prepress and postpress services)
These data, and the overarching year-to-year trends, like other demographic data, can be used not only for business planning and forecasting, but also sales and marketing resource allocation.
This Macro Moment
The usual forecasters are not especially bullish on Q1 2022 GDP. Via Calculated Risk, the consensus is barely a +1% increase. Bank of America is tracking a +0.4% increase from Q4 2021 and Goldman +0.5%. The Atlanta Fed’s GDPNow had been comparatively optimistic, with an expected +1.3% QoQ increase, but earlier this week revised their expectation down to +0.9%. What’s the problem? Employment has been great, the last few quarters of GDP had been pretty good, so what’s going on? They point to three indicators that have been on the decline: real personal consumption expenditures growth, first-quarter real gross private domestic investment, and change in real net exports.
The official advance estimate of Q1 GDP from the Bureau of Economic Analysis will be April 28. Maybe the forecasters are wrong…


