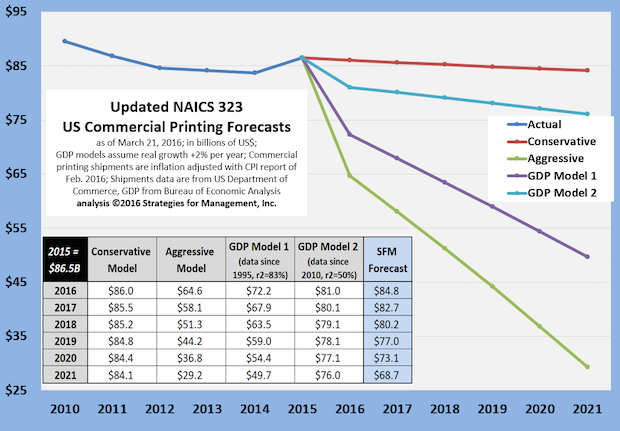
Now that 2015 data are complete, we have run the forecasting models again and present them in this chart. Our forecasting approach is different from others and those philosophies are described in a column from February 2015 and with a follow-up in June 2015. The long run trend since 2000 has been for real commercial printing shipments to decline -2% per year, and that remains a conservative way to forecast total industry shipments.
Industry forecasts are never forecasts of individual companies, but serve as a guide for general conditions and a means to discern better companies from others. Individual companies can increase sales in many, many ways, but aggregate shipments can be decreasing at the time such achievements are made. The GDP regression models still show a negative relationship with GDP. One model has the relationship at a +$1 billion increase in real GDP resulting in a -$12 million decrease in commercial printing shipments. The other has it at a -$2.8 million decrease. This is a very interesting time for printing companies and the wide range of statistical forecasts show that.
Models just crunch numbers; people making real decisions about real resources and solving real problems are what change markets, not statistical models. The models are a guide to understanding the net possible effects of the interaction of many confusing and conflicting trends. The Commerce Department issues multiple-year revisions in mid-May and we will run the forecasts again and report accordingly at that time.


