As 2023 began, there were 947 establishments in NAICS 32312 (Support Activities for Printing). This represents a decrease of 54% since 2010.
The U.S. Census Bureau officially designates NAICS 32312 as “Support Activities for Printing,” identifying these businesses as
establishments primarily engaged in performing prepress and postpress services in support of printing activities. Prepress services may include such things as platemaking, typesetting, trade binding, and sample mounting. Postpress services include such things as book or paper bronzing, die cutting, edging, embossing, folding, gilding, gluing, and indexing.
It’s not difficult to understand why establishments in this category have been dropping, especially if you read the definition of “prepress” above. In fact, it’s kind of surprising that it hasn’t declined more than it has: prepress has largely been absorbed into the printing process itself. Especially in digital printing workflows, prepress is little more than what happens in the digital front end. As a result, there is no need for an entire business to be dedicated to prepress the way there was back in the heyday of the service bureau. In fact, as automation continues to penetrate into printing companies, there is less and less need for prepress employees—and, again, even less of a need for a business to be completely dedicated to prepress. (Remember when “color separators” had its own NAICS? That entire business category was replaced by a single command in Photoshop.) We suspect that many business that had once been solely prepress-oriented have moved into new kinds of services, such as graphic design, wide-format printing, perhaps even other kinds of digital printing, while still retaining their legacy NAICS classification.
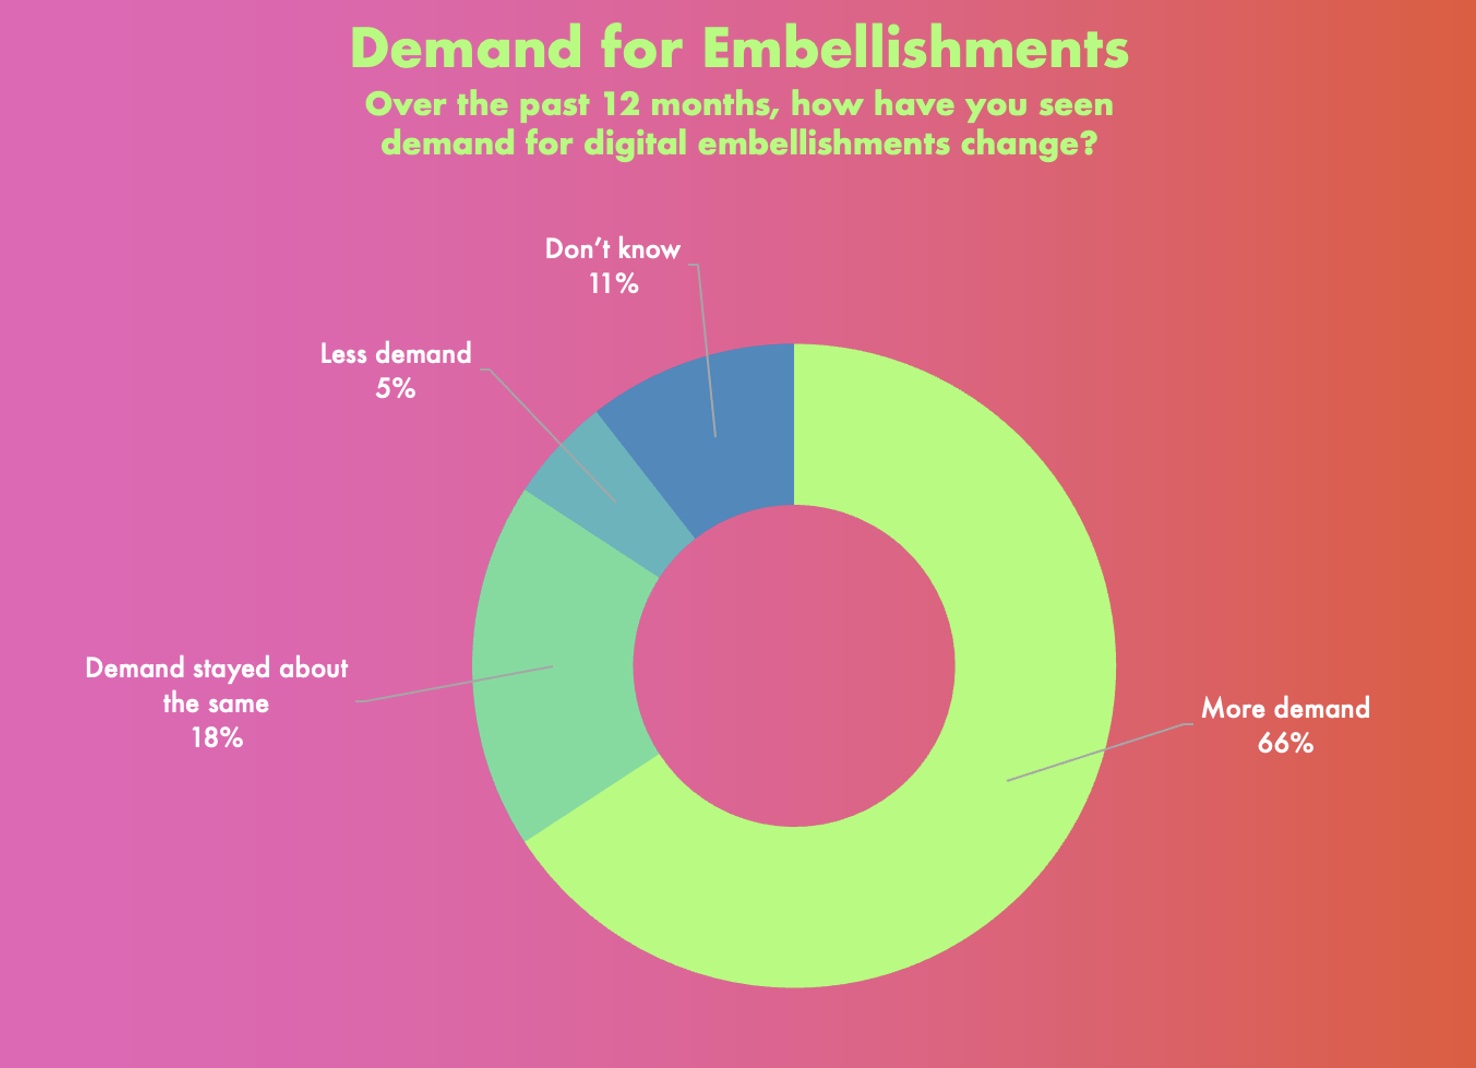
Finishing is a different beast. A lot of print businesses have been adding in-house binding and finishing, since, in this age of fast turnaround, who has time to send a job out for finishing? Still, dedicated bindery services businesses are still around, and they have shifted a lot of their focus to higher-end finishing services, such as embellishments (be they digital or not), and the kinds of services that print businesses may not want to add in-house. After all, one print shop can’t add every finishing process under the sun, despite the growing prevalence of all-in-one machines.
If you’re wondering how many of these establishments are prepress and how many are postpress, before 2012, County Business Patterns broke them out separately, and in 2011, the balance was 56% prepress and 44% postpress, and, if that ratio is still accurate—and it’s likely that it isn’t—that would work out to 530 prepress and 417 postpress establishments in 2023, although we suspect the skew is more toward postpress at this stage.
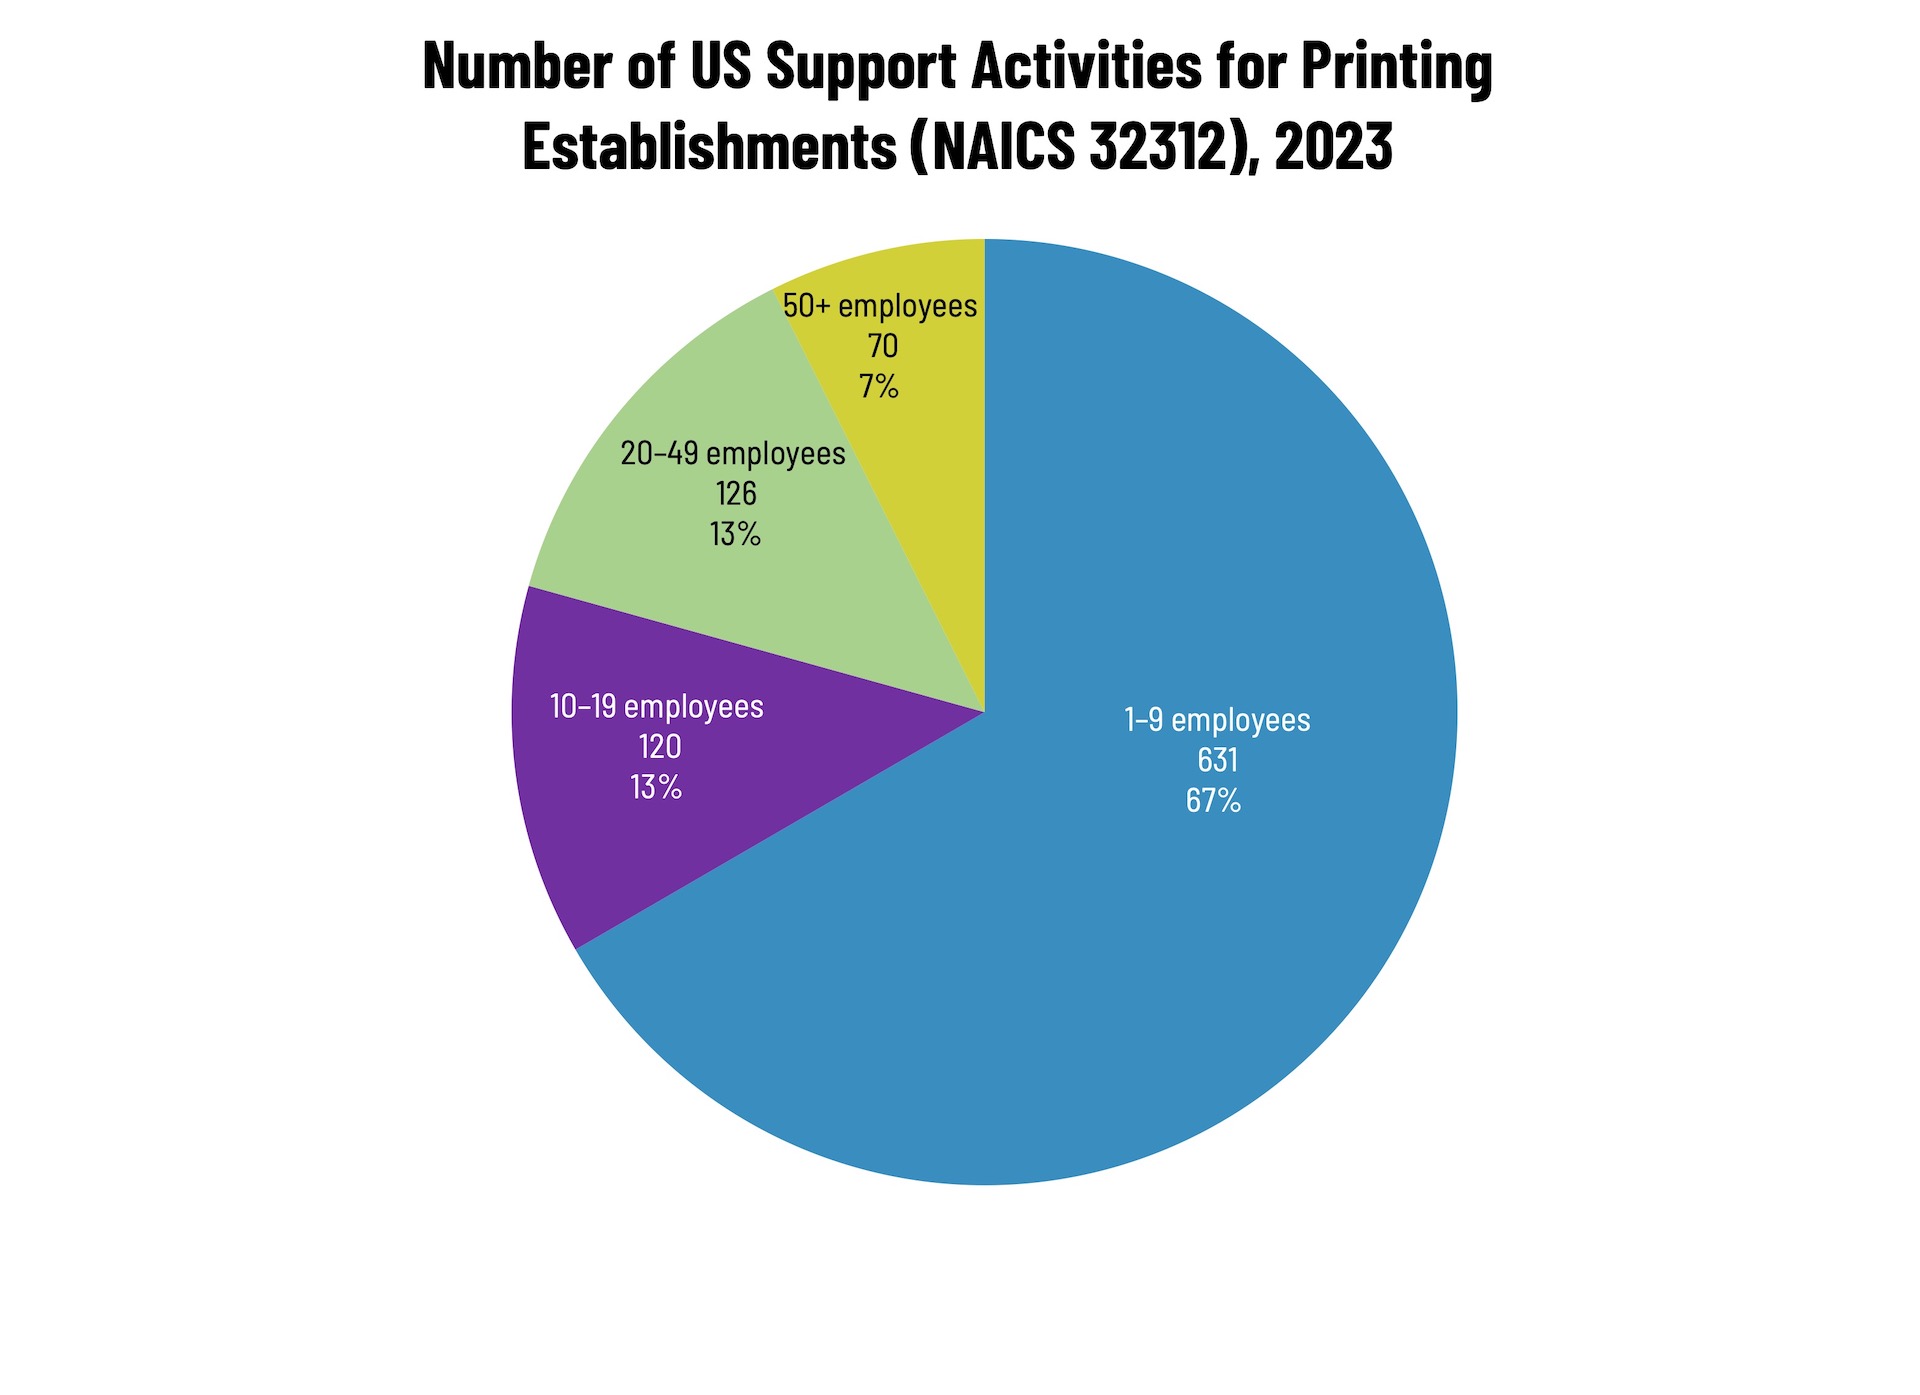
Like other printing categories, pre- and postpress establishments are concentrated at the lower end of the employee-count spectrum. Small shops (1 to 9 employees) comprise the bulk of the establishments, accounting for 67% of all establishments, with the largest shops accounting for only 7% of industry establishments with mid-size shops accounting for 26% of establishments.
These counts are based on data from the Census Bureau’s County Business Patterns. Throughout this year, we will be updating these data series with the latest CBP figures. County Business Patterns includes other data, such as number of employees, payroll, etc. These counts are broken down by commercial printing business classification (based on NAICS, the North American Industrial Classification System).
This finishes out 323 establishments. Up next, the publishing markets:
- 511 Publishing Industries (except Internet)
- 51111 Newspaper Publishers
- 51112 Periodical Publishers
- 51113 Book Publishers
- 51114 Directory and Mailing List Publishers
- 51119 Other Publishers
- 511191 Greeting Card Publishers
- 511199 All Other Publishers
These data, and the overarching year-to-year trends, like other demographic data, can be used not only for business planning and forecasting, but also sales and marketing resource allocation.
This Macro Moment…
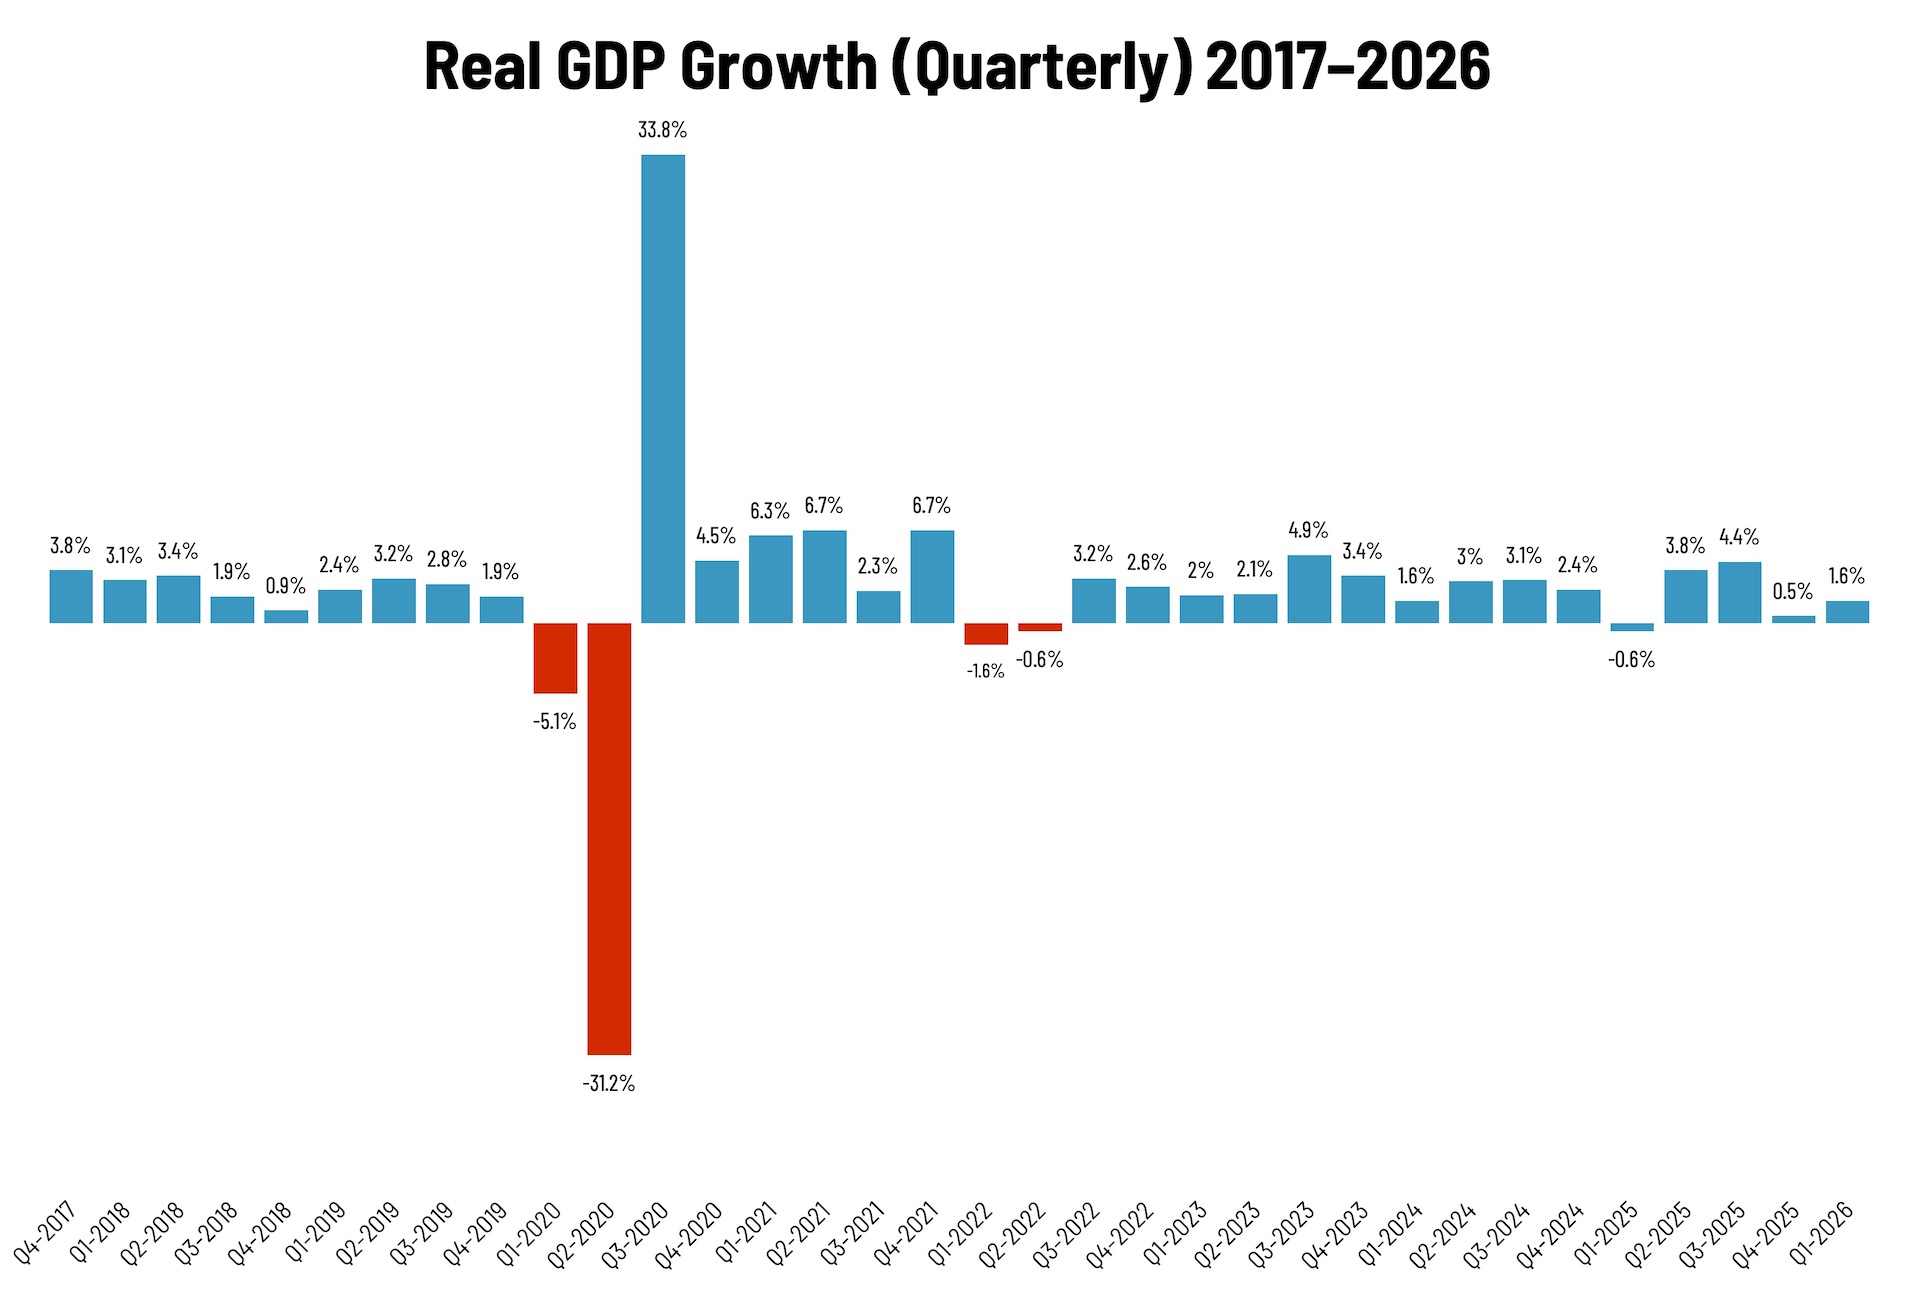
Last week, the Bureau of Economic Analysis released its second estimate of Q1 2026 GDP growth:
Real gross domestic product (GDP) increased at an annual rate of 1.6 percent in the first quarter of 2026 (January, February, and March), according to the second estimate released today by the U.S. Bureau of Economic Analysis. In the fourth quarter of 2025, real GDP increased 0.5 percent.
Q1 GDP was revised down from 2.0% in the advance estimate. Still, it’s better than 0.5% growth in Q4 2025.
As for expectations for Q2 GDP, via Calculated Risk’s Weekly Economic Report, Bank of America is forecasting 2.5% growth, Goldman 2.0%, and the Atlanta Fed’s GDPNow 3.8% (!).
Digging into the BEA report a bit more deeply, personal income was down in April.
Personal income decreased less than $0.1 billion (less than 0.1 percent at a monthly rate) in April, according to estimates released today by the U.S. Bureau of Economic Analysis (BEA). Disposable personal income (DPI)—personal income less personal current taxes—decreased $19.9 billion (0.1 percent), and personal consumption expenditures (PCE) increased $111.1 billion (0.5 percent).
This could explain why consumer sentiment is at an all-time low.