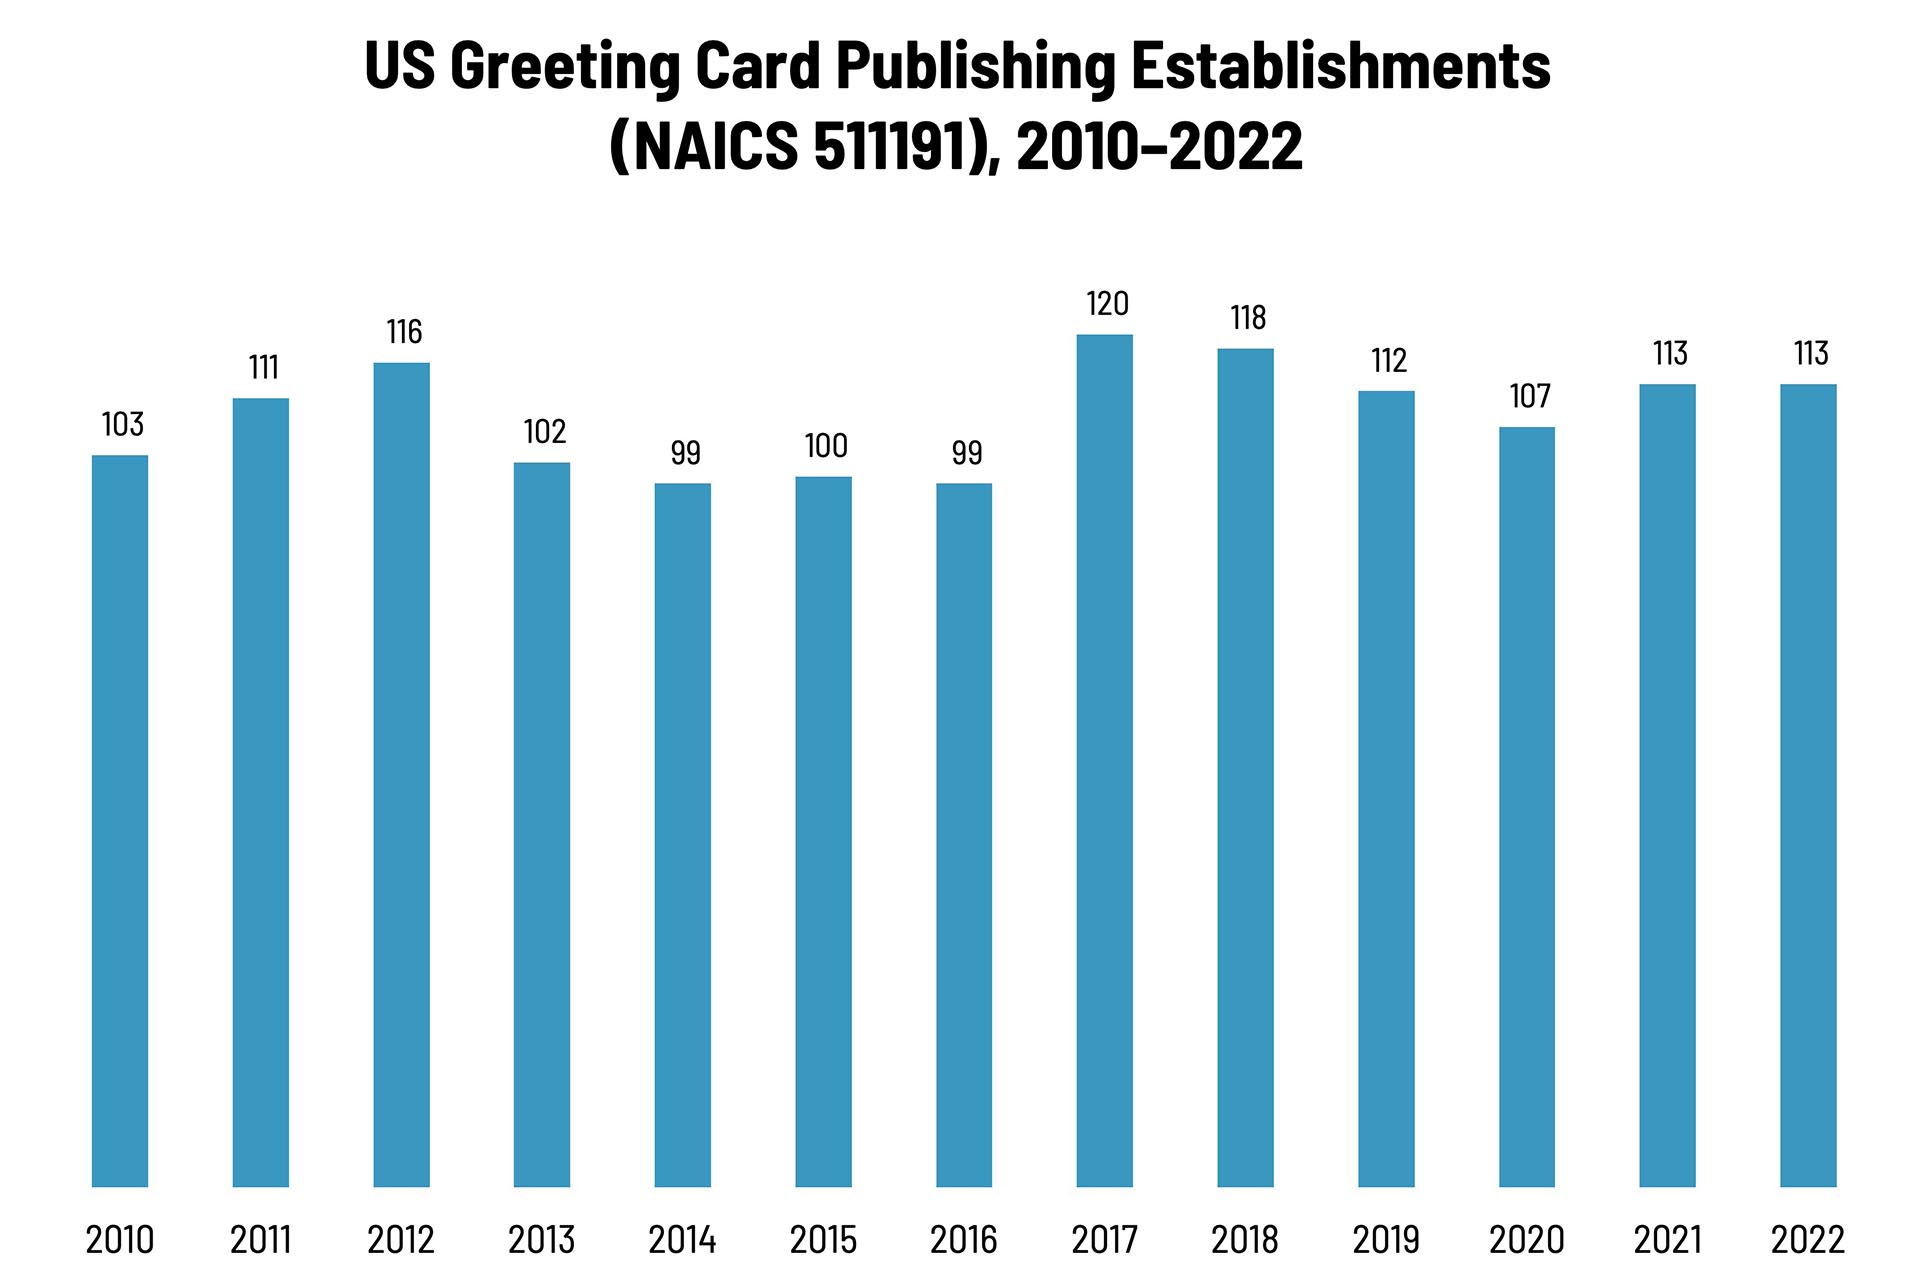
Our Friday data slice’n’dice look at the latest edition of County Business Patterns has been detailing the publishing industries. As 2022 began, there were 113 establishments in NAICS 511191 (Greeting Card Publishing)—the same number as in 2021. Although this represents a net increase of 10% since 2010, it has been a category that has ebbed and flowed over the course of the decade, although we’re not talking about a tremendous number of establishments.
The Greeting Card Association doesn’t seem to have the general industry statistics they used to, but as recently as 2018 they had found:
- Americans purchase approximately 6.5 billion greeting cards each year. Annual retail sales of greeting cards are estimated between $7 and $8 billion.
- Nine out of every ten households buy greeting cards each year.
- USPS reported that greeting card mail volume has increased last year, for the fourth year in a row (USPS Household Diary Study).
NDP Analytics had found in 2020 that:
- Unlike the stamped letter category overall, greeting cards experienced growth from FY 2015-18. However, in FY 2019, greeting card volume suddenly declined more than 15%.
They add:
- The timing of the decline in greeting card volume parallels the 10% increase in first-ounce stamp prices. It is the only factor that appears to align with the change in greeting card volume. While other factors, such as electronic diversion, contribute to steady decreases in physical greeting card volume, they cannot explain the sudden decline in FY 2019.
The Greeting Card Association published a 2022 white paper on the subject of greeting card use by small businesses. Some interesting findings from the 2,000 small businesses they surveyed:
- One-third of small businesses send greeting cards during the winter holiday season
- 87% of those cards are physical, not e-
- 91% of greeting cards are sent to current customers
Digital technologies have made greeting card design and production easier than ever—although we note that it has become typical around the holidays to receive custom photocards containing family photos produced via the likes of Shutterfly. We have even run into a few artisans who have picked up a letterpress press and started a boutique card production facility in a garage.
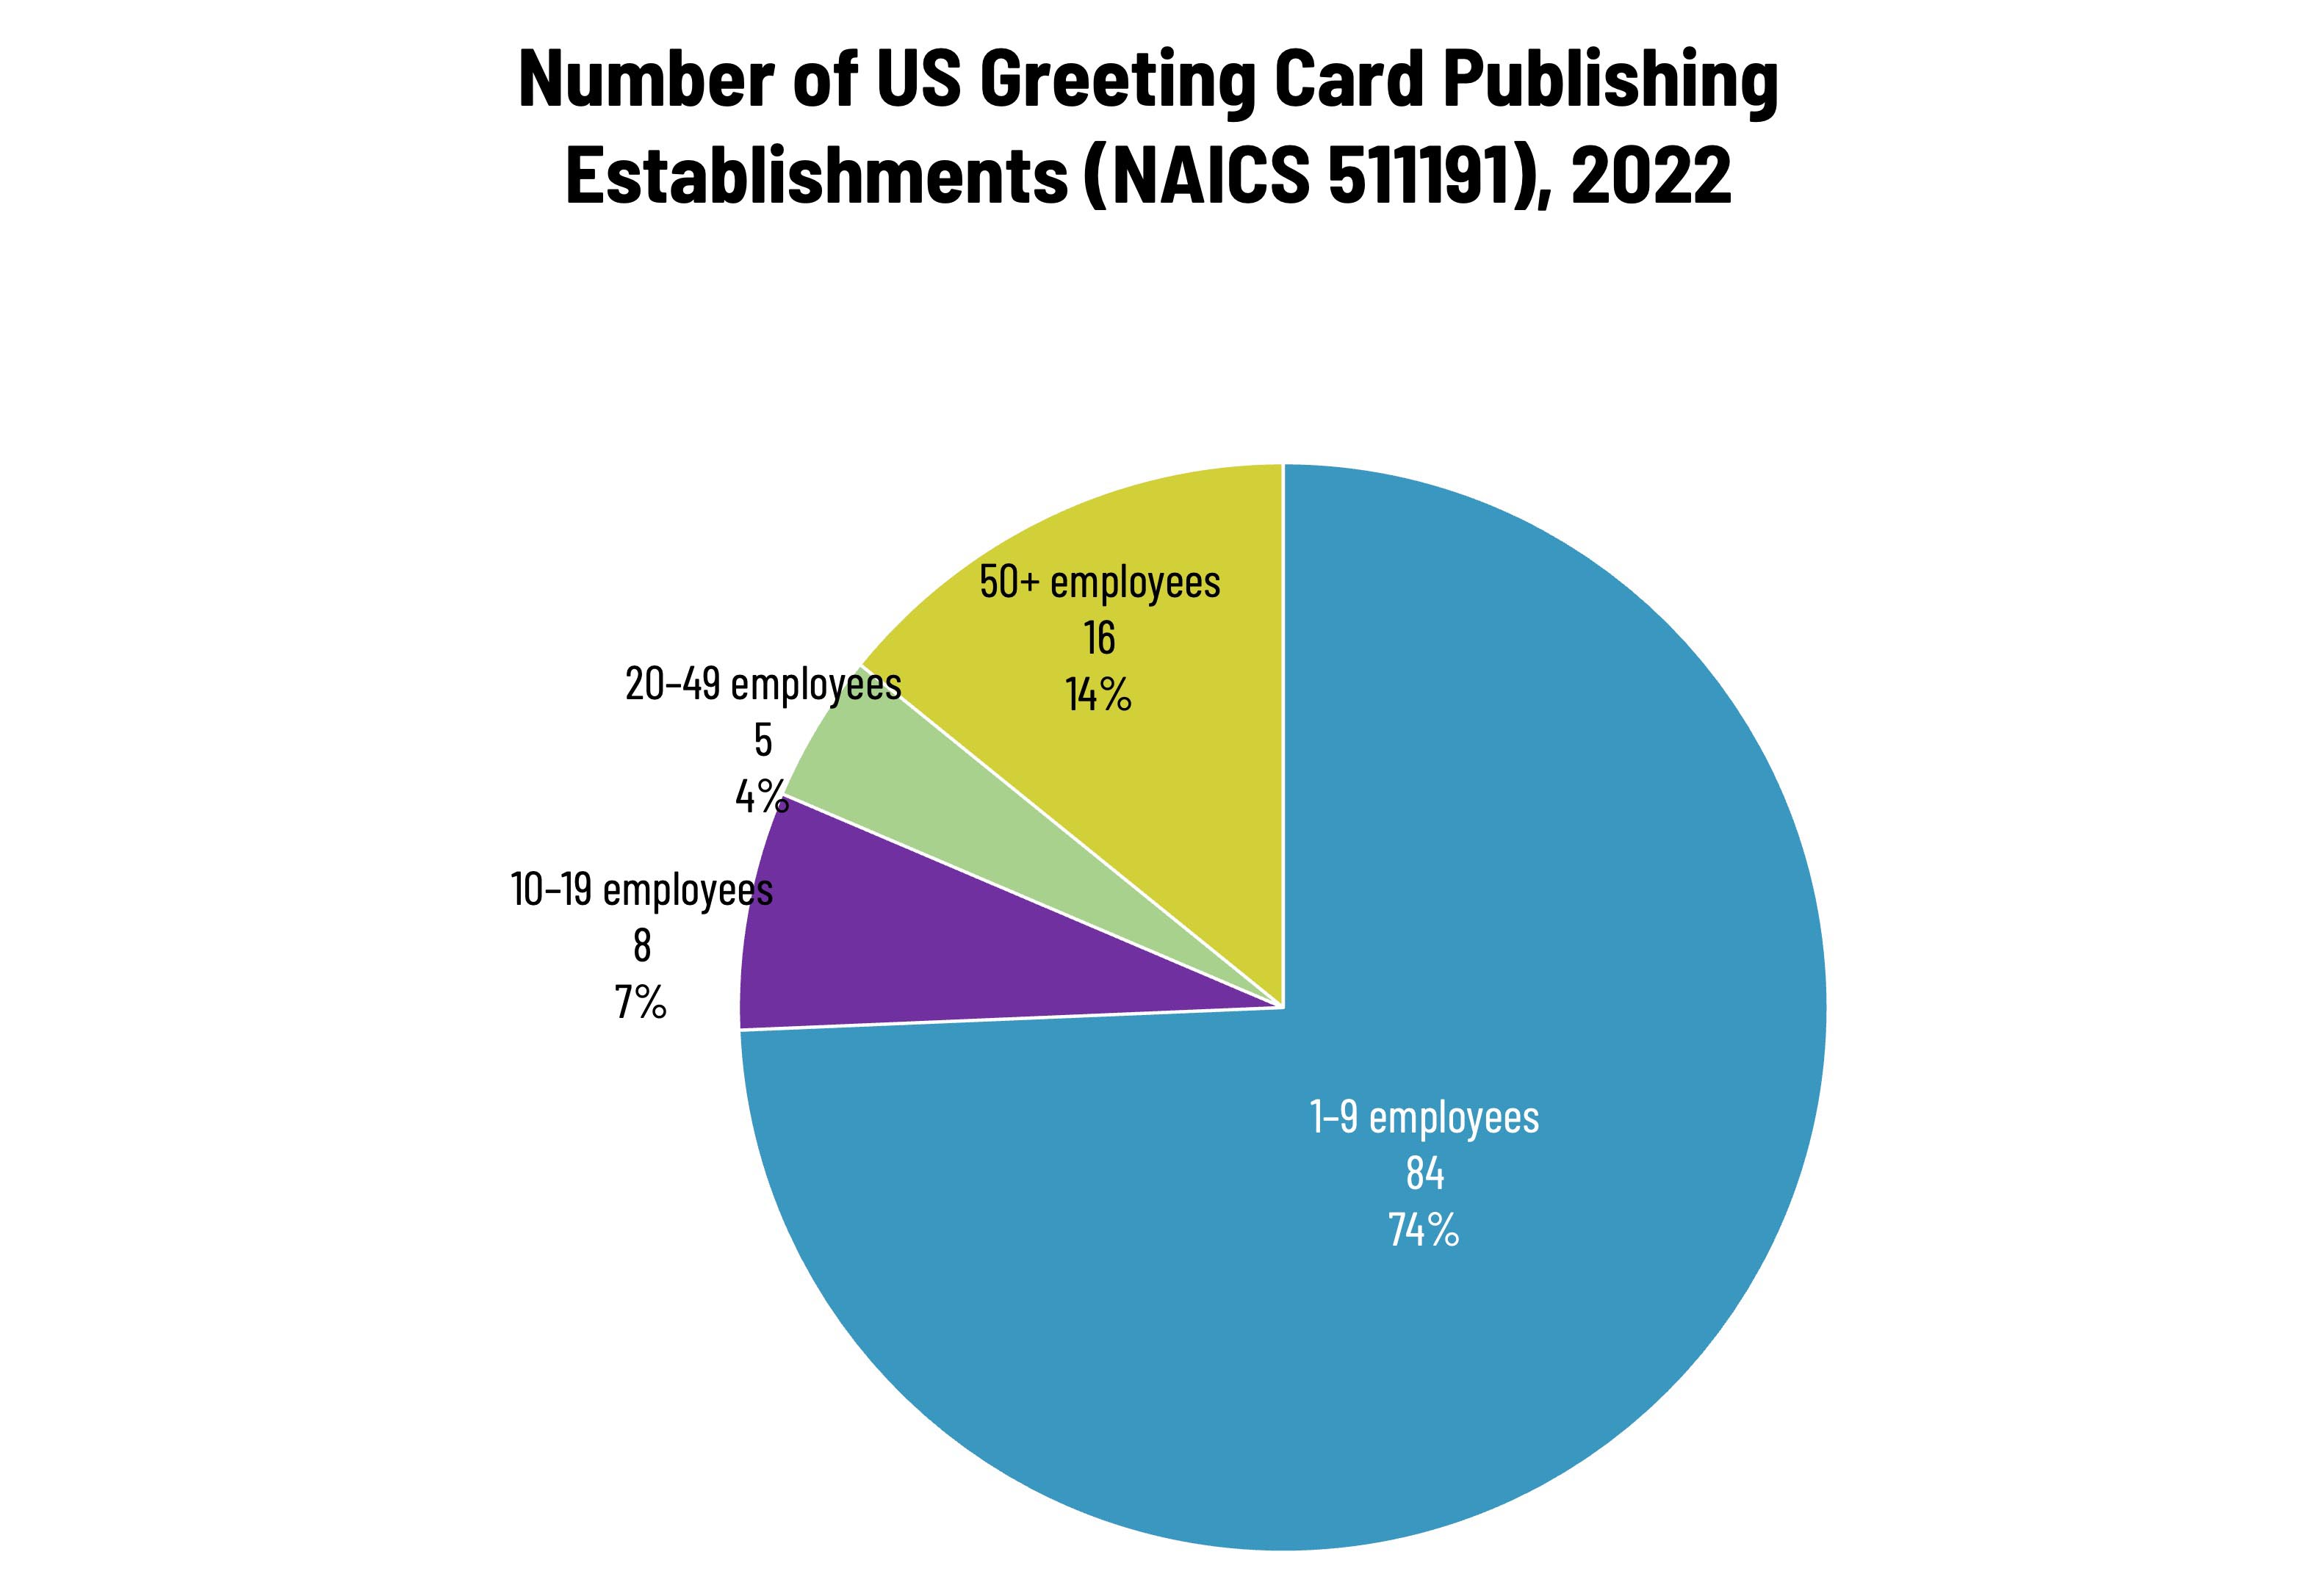
Greeting card publishing establishments are naturally concentrated at the lower end of the employee-count spectrum—and although the overall number of establishments has stayed the same, there was some movement within the individual size categories, which we can’t necessarily ascribe to consolidation, as that would lead to an overall decline in the number of establishments. Small publishers (1 to 9 employees) comprise the bulk of the establishments, accounting for 74% of all establishments. (The smallest employee size category dropped from the previous year, while the 10–19-employee and 50+-employee categories grew slightly.
These counts are based on data from the Census Bureau’s County Business Patterns. Throughout this year, we will be updating these data series with the latest CBP figures. County Business Patterns includes other data, such as number of employees, payroll, etc. These counts are broken down by commercial printing business classification (based on NAICS, the North American Industrial Classification System). Up next:
- 511199 All Other Publishers
- 51913 Internet Publishing and Broadcasting and Web Search Portals
These data, and the overarching year-to-year trends, like other demographic data, can be used not only for business planning and forecasting, but also sales and marketing resource allocation.
This Macro Moment…
According to the Bureau of Labor Statistics on Wednesday:
The Consumer Price Index for All Urban Consumers (CPI-U) increased 0.1 percent on a seasonally adjusted basis in May, after rising 0.2 percent in April, the U.S. Bureau of Labor Statistics reported today. Over the last 12 months, the all items index increased 2.4 percent before seasonal adjustment.
The primary factor in the increase was shelter, which rose 0.3% in May, and food, which also rose 0.3%. Happily, the energy index decreased 1.0%.
Indexes that increased over the month include medical care, motor vehicle insurance, household furnishings and operations, personal care, and education. The indexes for airline fares, used cars and trucks, new vehicles, and apparel were among the major indexes that decreased in May.
The change in CPI was slightly below economists’ expectations.
We should warn that “resource constraints” at the BLS have reduced the Consumer Price Index collection sample in areas across the country. The BLS determines the inflation rate by taking as many samples from as many different parts of the country as they can. Says the BLS:
BLS is reducing sample in areas across the country. In April, BLS suspended CPI data collection entirely in Lincoln, NE, and Provo, UT. In June, BLS suspended collection entirely in Buffalo, NY.
Sample reduction and collection suspension affect both the commodity and services survey and the housing survey. These actions have minimal impact on the overall all-items CPI-U index, but they may increase the volatility of subnational or item-specific indexes. The number of imputed items and the response rates increased in April due to these actions. BLS makes reductions when current resources can no longer support the collection effort. BLS will continue to evaluate survey operations.
And as you may know, the BLS also produces the monthly employment data report (among many other datasets) which may also be similarly affected by hiring freezes. Let’s hope the impact on data quality remains “minimal” as economists, investors, businesses, and others rely on these datasets for planning purposes. Via Reuters:
“The federal government hiring freeze and the drive to cut funding across federal agencies may be starting to impact the quality of economic data,” Omair Sharif, the president of Inflation Insights, wrote earlier on Wednesday, citing changes in how the CPI for April was constructed and noting as well the decision by the BLS to stop producing hundreds of indexes on producer prices.
“These indicators shape interest rate and tax policy, and it’s not a stretch to say that they affect the lives of everyday folks. Degrading the quality of these statistics only worsens future economic outcomes,” Sharif wrote.
Our Printing Outlook 2025 report is now available for download! The brand-new report provides detailed analysis of the latest WhatTheyThink Printing Industry Survey, the latest industry economic data and macroeconomic trends, as well as industry and cultural technological trends to look out for in 2025 and beyond. Purchase now!


