We continue our look at annual payroll in the printing industry.
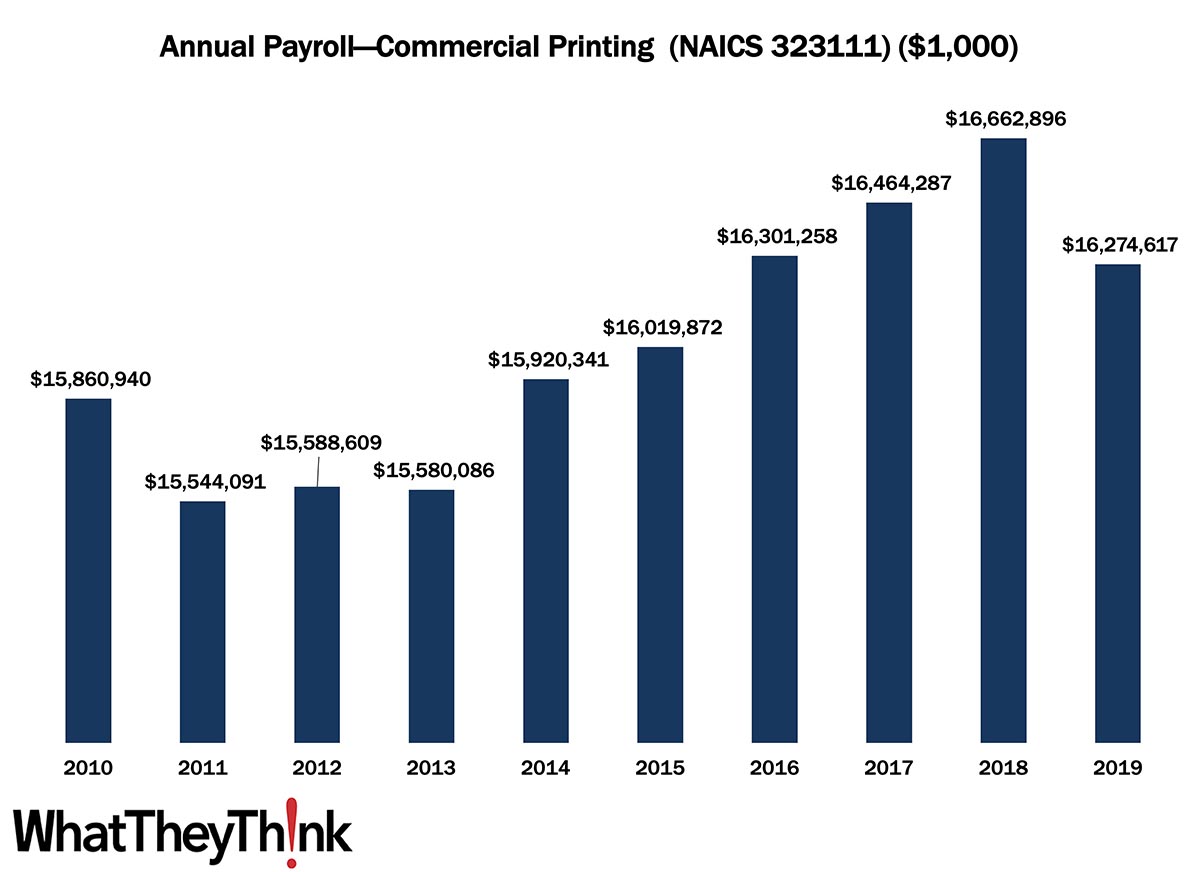
Last time, we looked at NAICS 32311 (Printing) and this week, we drill a bit deeper to look at NAICS 323111 (Commercial Printing [except Screen and Books]). In 2010, US commercial printing establishments had an annual payroll of $15.9 billion. Payrolls dipped during and in the aftermath of the Great Recession, but rose, at least on a current dollar basis, over the latter half of the decade before taking a pre-pandemic tumble in 2019, coming in at $16.3 billion in 2019. Note that County Business Patterns payroll data are reported in current, not inflation-adjusted, dollars. If we were to adjust for inflation, 2010 payroll would be equivalent to $18.5 billion in 2019, so we are essentially looking at an overall decline of -12% in payroll over the course of the decade. Now, this is not just due to inflation—employment and establishments had also declined by 16% and 23%, respectively, over that same time period.
A statistical note. In the 2012 Economic Census, the Census Bureau overhauled the three-digit NAICS 323 and rolled up a number of sub-categories. In 2010 and 2011 (that is, prior to 2012), the categories in NAICS 323 were:
- 323 Printing and related support activities
- 32311 Printing
- 323110 Commercial lithographic printing
- 323111 Commercial gravure printing
- 323112 Commercial flexographic printing
- 323113 Commercial screen printing
- 323114 Quick printing
- 323115 Digital printing
- 323116 Manifold business forms printing
- 323117 Books printing
- 323118 Blankbook, looseleaf binders, and devices manufacturing
- 323119 Other commercial printing
- 32312 Support activities for printing
- 323121 Tradebinding and related work
- 323122 Prepress services
Following the 2012 Economic Census, NAICS 323 was whittled down to:
- 323 Printing and Related Support Activities
- 32311 Printing
- 323111 Commercial Printing (except Screen and Books)
- 323113 Commercial Screen Printing
- 323117 Books Printing
- 32312 Support Activities for Printing
Many of those sub-NAICS categories were combined into 323111. To arrive at the 2010 and 2011 numbers in the chart above, we combined payroll for NAICS 323110, 323111, 323112, 323114, 323115, 323116, 323118, and 323119 to arrive at payroll for new NAICS 323111. Note that screen and book printing were left to their own NAICS categories.
In this space two weeks ago, we had remarked that, at least in the time period we are looking at here, the decline in industry employment was due to industry consolidation, retirement and workers otherwise exiting the industry without a ready pool of next-generation employees waiting to be hired, and, to a lesser extent, automation, although automation is increasingly being looked to as a solution to employees who have already been self-displaced—unlike in other industries where automation tends to displace workers.
Coming up next in this data series:
- 323113 (Commercial Screen Printing)
- 323117 (Books Printing)
- 32312 (Support Activities for Printing—aka prepress and postpress services)
These data, and the overarching year-to-year trends, like other demographic data, can be used not only for business planning and forecasting, but also sales and marketing resource allocation.
This Macro Moment
On Wednesday, the Bureau of Labor Statistics (BLS) released the latest inflation figures:
The Consumer Price Index for All Urban Consumers (CPI-U) increased 0.3 percent in April on a seasonally adjusted basis after rising 1.2 percent in March, the U.S. Bureau of Labor Statistics reported today. Over the last 12 months, the all items index increased 8.3 percent before seasonal adjustment.
Increases in the indexes for shelter, food, airline fares, and new vehicles were the largest contributors to the seasonally adjusted all items increase. The food index rose 0.9 percent over the month as the food at home index rose 1.0 percent. The energy index declined in April after rising in recent months. The index for gasoline fell 6.1 percent over the month, offsetting increases in the indexes for natural gas and electricity.
If you back out food and energy, CPI rose 0.6%. Note that core inflation grew to an annualized rate of 7.0% compared to 4.0% in the previous month, thanks to a large decrease in energy prices, which is reflected in overall in CPI but not in core CPI. Generally, this is good news and suggests—suggests—that our inflation woes are going to ease over the next few months. The Producer Price Index (PPI) also looks to be leveling off, up “only” 0.5% in April, compared to 1.6% in March and 1.1% in February.
The Grid has a very good article explaining why the causes of our inflationary problems are largely beyond the reach of the usual tools the Federal Reserve has to keep inflation in check. (The eternal challenge is raising interest rates enough to curb inflation without driving up unemployment and/or plunging us into a recession, as was the case in 1981–82.) As for what the government itself can do…well, not that much. The last time the government tried to impose price controls, after the outbreak of the Korean War, it did not go well.
But as with any economic indicator since 2020, who the heck knows what May inflation will look like. But this week’s data was about what economists had expected, so we’ll stay optimistic.


