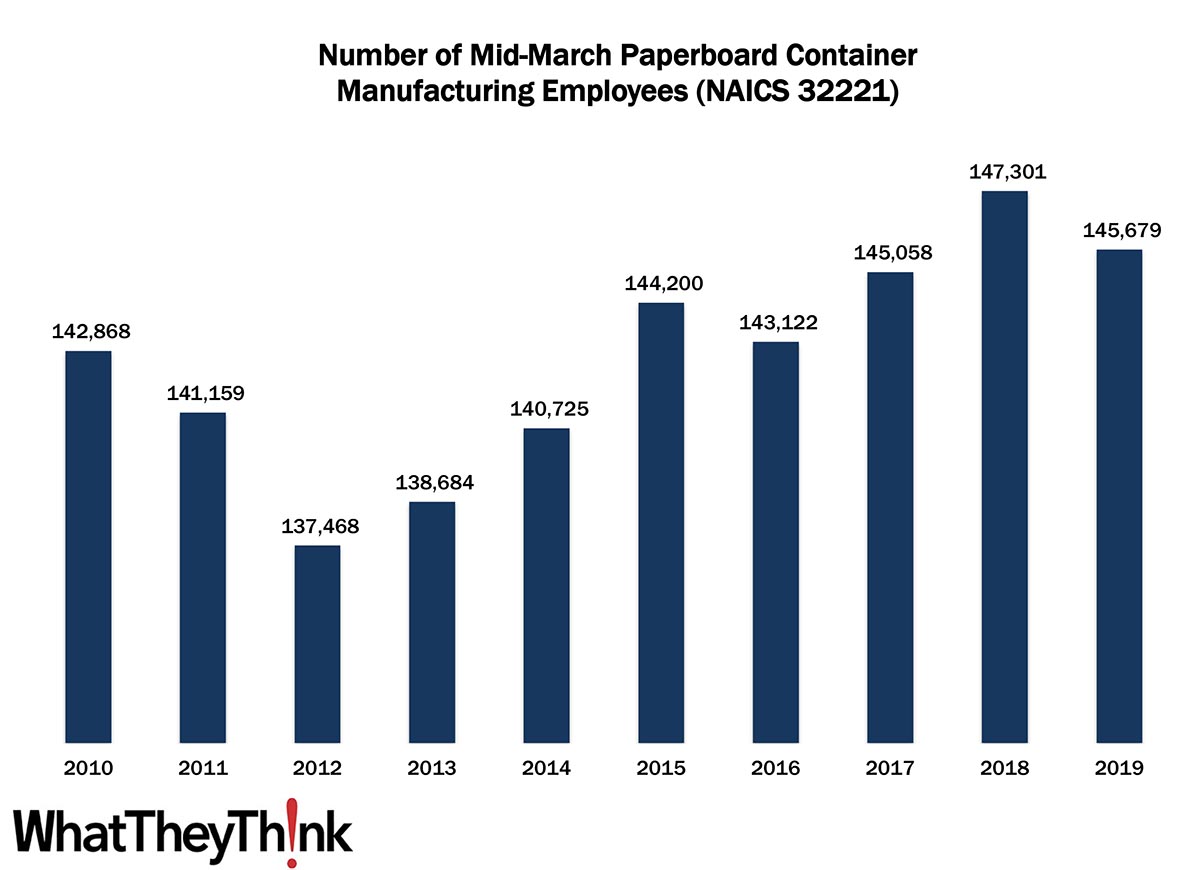
In 2010, there were 142,868 employees in NAICS 32221 (Paperboard Container Manufacturing establishments). Employment in this category dropped abruptly in 2011 and 2012, then continued to rise over the course of the decade, peaking in 2018 at 147,301 before dropping to 145,679 in 2019. As we said when we looked at overall establishments, in the period during and immediately following the Great Recession (the first half of the decade), there was no small amount of consolidation in all corners of the paper, converting, and printing industries, but by mid-decade, ecommerce had been driving demand for more and newer types of corrugated boxes. Software prototyping of packaging such as boxes results in innovative designs, which can optimize the logistics of transporting packages, especially from overseas manufacturers. This has only accelerated since, but environmental concerns are becoming more important in box conversion.
The 3222 four-digit NAICS comprises a variety of different converted packaging types, and over the next several months, we will be looking at them in turn, including:
- 322211 Corrugated and Solid Fiber Box Manufacturing
- 322212 Folding Paperboard Box Manufacturing
- 322219 Other Paperboard Container Manufacturing
- 32222 Paper Bag and Coated and Treated Paper Manufacturing
- 32223 Stationery Product Manufacturing
- 32229 Other Converted Paper Product Manufacturing
- 322291 Sanitary Paper Product Manufacturing
- 322299 All Other Converted Paper Product Manufacturing
These counts are based on data from the Census Bureau’s County Business Patterns. Every other week, we update these data series with the latest figures. You may have noticed that the latest edition of County Business Patterns was released last month, which now includes 2019 data. Once we have finished with the Converting NAICS, we will circle back to the beginning and update establishment and other counts in the printing, publishing, and creative NAICS.
These data, and the overarching year-to-year trends, like other demographic data, can be used not only for business planning and forecasting, but also sales and marketing resource allocation.
This Macro Moment
Work (and shop) from home are taking a toll on commercial real estate. Via Calculated Risk: “Reis reported the office vacancy rate was at 18.5% in Q2, up from 18.2% in Q1, and up from 17.1% in Q2 2020.” They add: “This is the highest vacancy rate for offices since the early ’90s (following the S&L crisis).” The previous peak had been in 2011, a result of the Great Recession, and really hadn’t recovered. As a result, office vacancy rates were abnormally high even before the pandemic.
This report also looks at mall vacancy rates, which, if you had been in a mall at any time in 2018 or 2019, also has been seeing abnormally high vacancy rates as the “retail apocalypse” took its toll on both anchor stores and smaller mall retailers.
For Neighborhood and Community malls (strip malls), the vacancy rate was 10.5% in Q2, down from 10.6% in Q1, and up from 10.2% in Q2 2020.
For Regional malls, the vacancy rate was 11.5% in Q2, up from 11.4% in Q1, and up from 9.8% in Q2 2020.
Likewise, the previous peak vacancy rates had been in 2011, and never dropped back to a pre-Recession low.
Office and mall vacancy rates have a number of macroeconomic impacts, but they also don’t bode well for sign and display graphics businesses (or other print businesses, for that matter) that specialize in experiential graphics for offices—which had been a major growth area in the Before Times—or signage and other graphics for retail.
Both of these trends were only inflamed by the pandemic, and it doesn’t seem likely that there will be a major reversal in the foreseeable future.


