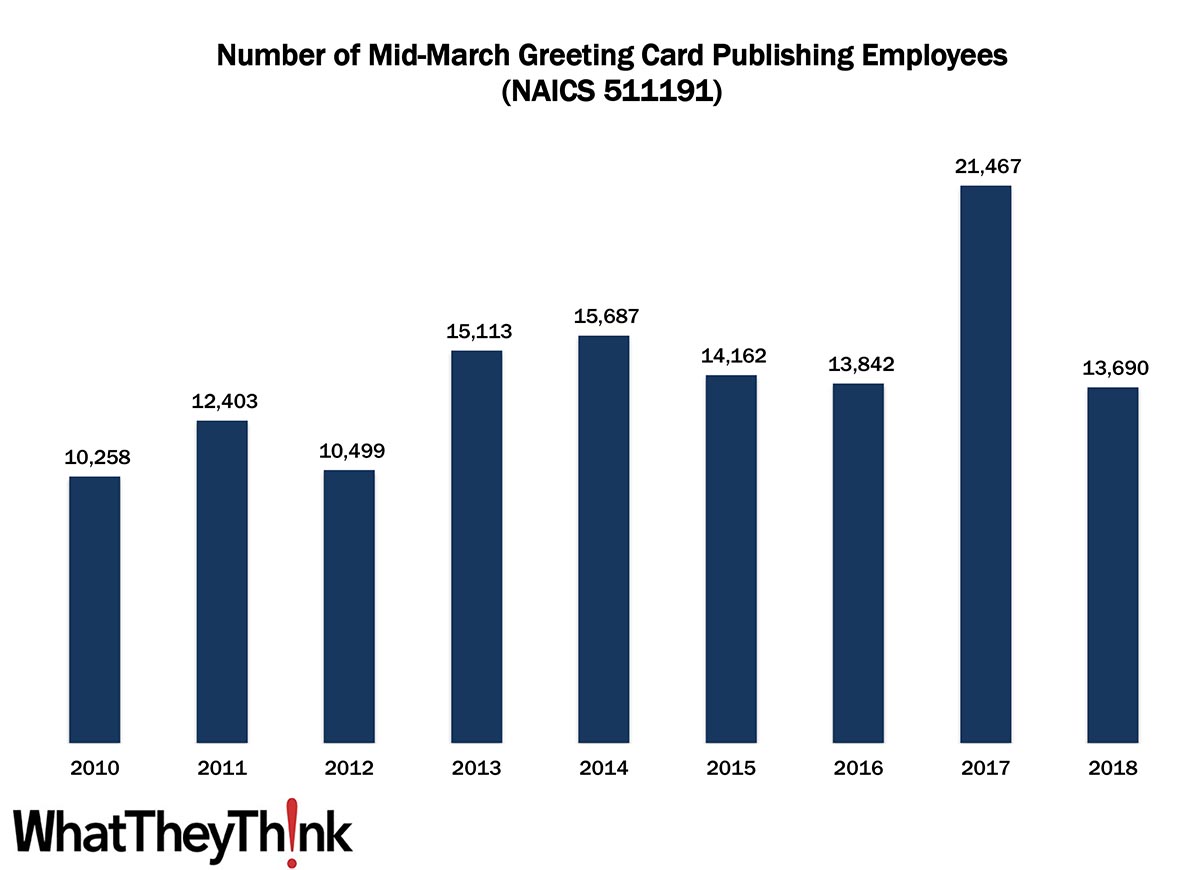
In 2010, there were 10,258 employees working in Greeting Card Publishing (NAICS 511191) establishments, a number which has been up and down over the course of the decade. There was an anomalous peak in 2017 of 21,467, but declined again the following year to 13,690. It’s perhaps easy to think of greeting cards as fairly quaint in this age social media (aren’t we more likely to get a happy birthday message on Facebook than a printed card?), but printed greeting cards are still big business. Says the Greeting Card Association:
- Americans purchase approximately 6.5 billion greeting cards each year. Annual retail sales of greeting cards are estimated between $7 and $8 billion.
- Nine out of every ten households buy greeting cards each year.
- USPS reported that greeting card mail volume has increased last year, for the fourth year in a row (USPS Household Diary Study).
And, to our point here, “Hundreds of new card companies are launched each year, with Millennial ‘Makers’ forming most new card companies.” Digital technologies have made greeting card design and production easier than ever, and we have even run into a few artisans who have even picked up a letterpress press and started a boutique card production facility in a garage. These numbers obviously don’t include the pandemic year, but printed mail and greetings cards were ways that people stayed connected during lockdown. So it will be interesting to see those demographics in a few years.
These counts are based on data from the Census Bureau’s County Business Patterns. Every other week, we update these data series with the latest figures. These counts are broken down by printing business classification (based on NAICS, the North American Industrial Classification System). We have one more publishing category to go before we turn to packagers and converters:
- 511199 All Other Publishers
For some of these categories, we will also supplement County Business Patterns data with Nonemployer Statistics, which counts freelancers.
These data, and the overarching year-to-year trends, like other demographic data, can be used not only for business planning and forecasting, but also sales and marketing resource allocation.
This Macro Moment
Well maybe not entirely macro. Anyway, as we started thinking about and planning for the fall trade events, we came across, via Calculated Risk, some interesting data: Las Vegas visitor traffic. From the Las Vegas Visitor Authority:
The upward trajectory of tourism indicators continued in May as the destination welcomed nearly 2.9M visitors, + 11.8% MoM and down roughly -22% vs. May 2019.
Hotel occupancy reached nearly 71%, up 5.3 pts MoM, as Weekend occupancy approached 88%, coming within 8.6 pts of May 2019 levels. Midweek occupancy saw gains as well, reaching 62.8%, up 4.9 pts MoM and down 25.3 pts vs. May 2019.
There has been no convention traffic since March 2020, so convention traffic is down 100% from May 2019. However, Las Vegas has reopened to conventions in June, so look for convention traffic to rise substantially. (In all fairness, though, COVID is probably not the worst thing you can catch in Vegas.)
More signs that we are slowly but surely getting back to normal.


