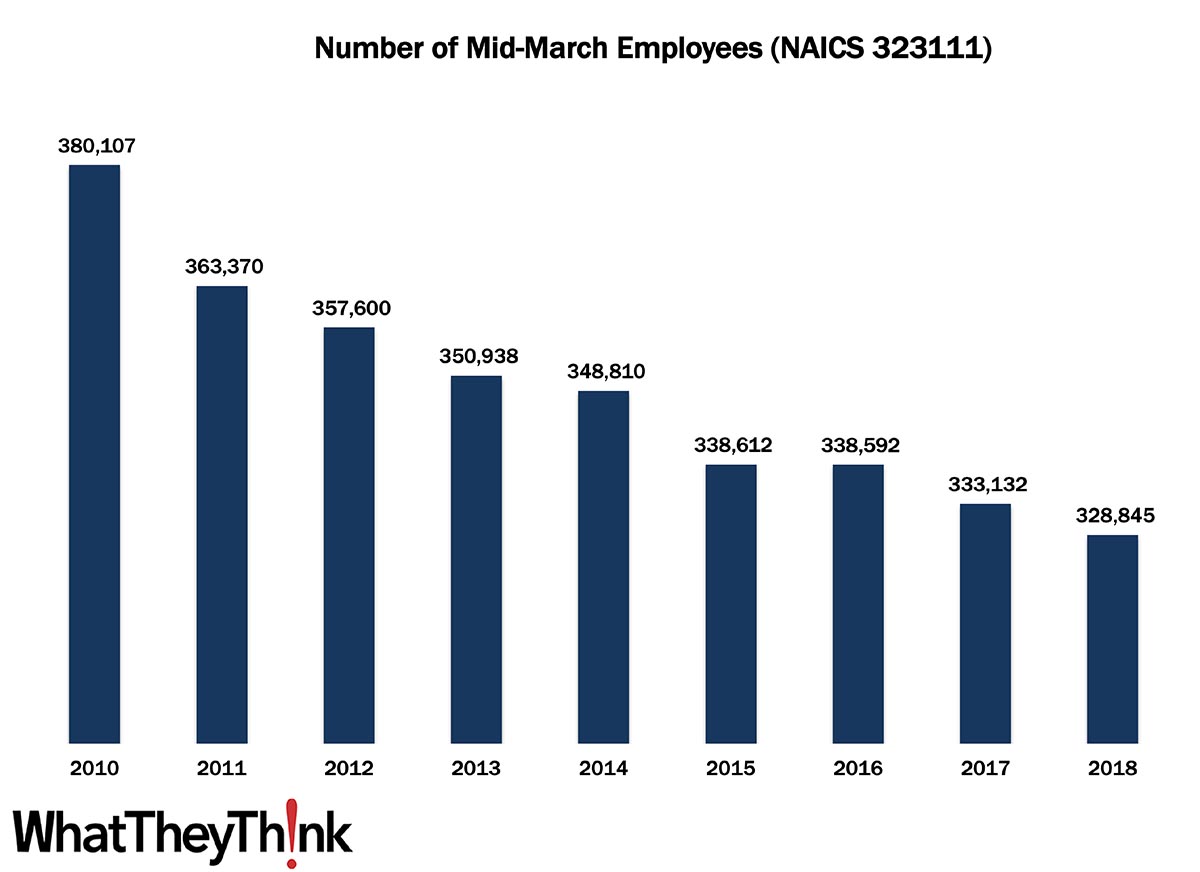
Two weeks ago, we began a new data series in our Friday Data Slice’n’Dice based on data from County Business Patterns: graphic arts employees. We had started with NAICS 323 (Printing and related support activities), and this week, we drill down into NAICS 323111 (Commercial Printing Except Screen and Books). In 2010, there were 380,107 employees working in US establishments in NAICS 323111 and by 2018, that number had declined -13.5% to 328,845.
A statistical note. In the 2012 Economic Census, the Census Bureau overhauled the three-digit NAICS 323 and removed a number of sub-categories. In 2010 and 2011 (that is, prior to 2012), the categories in NAICS 323 were:
- 323 Printing and related support activities
- 32311 Printing
- 323110 Commercial lithographic printing
- 323111 Commercial gravure printing
- 323112 Commercial flexographic printing
- 323113 Commercial screen printing
- 323114 Quick printing
- 323115 Digital printing
- 323116 Manifold business forms printing
- 323117 Books printing
- 323118 Blankbook, looseleaf binders, and devices manufacturing
- 323119 Other commercial printing
- 32312 Support activities for printing
- 323121 Tradebinding and related work
- 323122 Prepress services
Following the 2012 Economic Census, NAICS 323 was whittled down to:
- 323 Printing and Related Support Activities
- 32311 Printing
- 323111 Commercial Printing (except Screen and Books)
- 323113 Commercial Screen Printing
- 323117 Books Printing
- 32312 Support Activities for Printing
To arrive at the 2010 and 2011 numbers in the chart above, we backed NAICS 323113 and NAICS 323117 out of the employee count for 32311.
In this space two weeks ago, we had remarked that, at least in the time period we are looking at here, the decline in industry employment was due to industry consolidation, retirement and workers otherwise exiting the industry without a ready pool of next-generation employees waiting to be hired, and, to a lesser extent, automation, although automation is increasingly being looked to as a solution to employees who have already been self-displaced—unlike in other industries where automation tends to displace workers.
These counts are based on data from the Census Bureau’s County Business Patterns. Every other week, we update these data series with the latest figures. These counts are broken down by printing business classification (based on NAICS, the North American Industrial Classification System). Next up, we will be looking at employment in:
- 323113 (Commercial Screen Printing)
- 323117 (Books Printing)
- 32312 (Support Activities for Printing—aka prepress and postpress services)
These data, and the overarching year-to-year trends, like other demographic data, can be used not only for business planning and forecasting, but also sales and marketing resource allocation.
This Macro Moment
If one good thing has come out of the pandemic, it’s that inflation has been soft. This week, the BLS released its January Consumer Price Index (CPI) data:
The Consumer Price Index for All Urban Consumers (CPI-U) increased 0.3 percent in January on a seasonally adjusted basis, the U.S. Bureau of Labor Statistics reported today. Over the last 12 months, the all items index increased 1.4 percent before seasonal adjustment.
The gasoline index continued to increase, rising 7.4 percent in January and accounting for most of the seasonally adjusted increase in the all items index. Although the indexes for electricity and natural gas declined, the energy index rose 3.5 percent over the month. The food index rose slightly in January, increasing 0.1 percent as an advance in the index for food away from home more than offset a decline in the index for food at home. The index for all items less food and energy was unchanged in January. The indexes for apparel, medical care, shelter, and motor vehicle insurance all increased over the month. The indexes for recreation, used cars and trucks, airline fares, and new vehicles all declined in January.
The all items index rose 1.4 percent for the 12 months ending January, the same increase as for the period ending in December. The index for all items less food and energy also rose 1.4 percent over the last 12 months, a smaller increase than the 1.6-percent rise for the 12 months ending December. The food index rose 3.8 percent over the last 12 months. In contrast to these increases, and despite rising in recent months, the energy index declined 3.6 percent over the last year.
So at least there’s one thing we don’t have to worry about!


