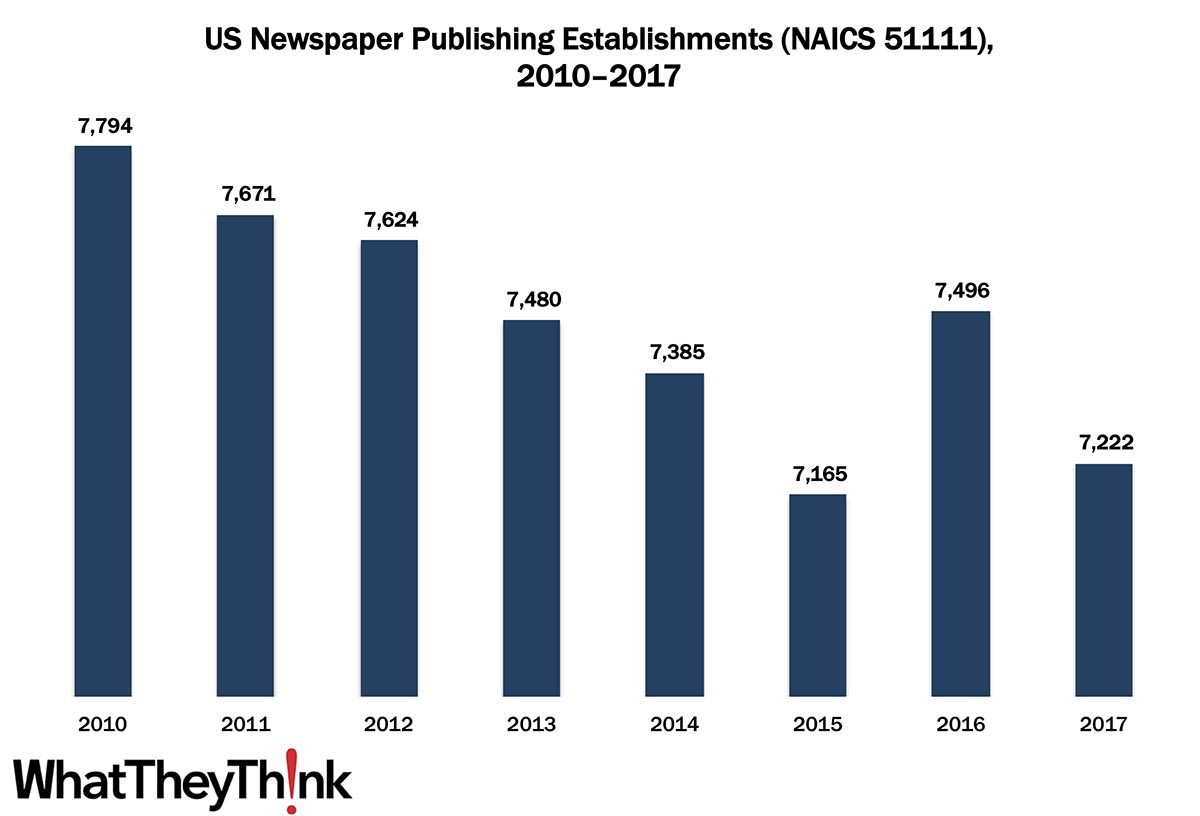
In 2010, there were 7,794 establishments in Newspaper Publishing (NAICS 51111); by 2017, that number had dropped to 7,222. It’s tempting to blame the Internet on the decline of newspaper circulation, but that really only hastened a trend that started with the advent of television (and the nightly news) and then by the advent of 24-hour cable news. At the same time, there has been tremendous consolidation among newspaper publishers, with one company owning many local papers, and even centralizing editorial and production facilities. As Frank Romano pointed out in a recent video, the hardest hit have been small, local papers, which has serious consequences for local journalism.
These counts are based on data from the Census Bureau’s County Business Patterns. Throughout this year, we will be updating these data series with the latest CBP figures. County Business Patterns includes other data, as well, such as number of employees, payroll, etc. These counts are broken down by publishing business classification (based on NAICS, the North American Industrial Classification System):
- 511 Publishing Industries (except Internet)
- 5111 Newspaper, Periodical, Book, and Directory Publishers
- 51111 Newspaper Publishers
- 51112 Periodical Publishers
- 51113 Book Publishers
- 51114 Directory and Mailing List Publishers
- 51119 Other Publishers
- 511191 Greeting Card Publishers
- 511199 All Other Publishers
These data, and the overarching year-to-year trends, like other demographic data, can be used not only for business planning and forecasting, but also sales and marketing resource allocation.
Every other week, we will be breaking these establishment data down in different ways. Over time, we will be adding additional data from County Business Patterns, such as number of employees, payroll, and similar information for additional business classification of relevance to the graphic communications industry.
This Macro Moment
We also want to mention that, yesterday, the Bureau of Economic Analysis released revised GDP figures—Q1 2020 decreased at an annual rate of -5.0%, revised down from-4.8%. Q4 2019 was unchanged at +2.1%. “[A] downward revision to private inventory investment was partly offset by upward revisions to personal consumption expenditures (PCE) and nonresidential fixed investment.”
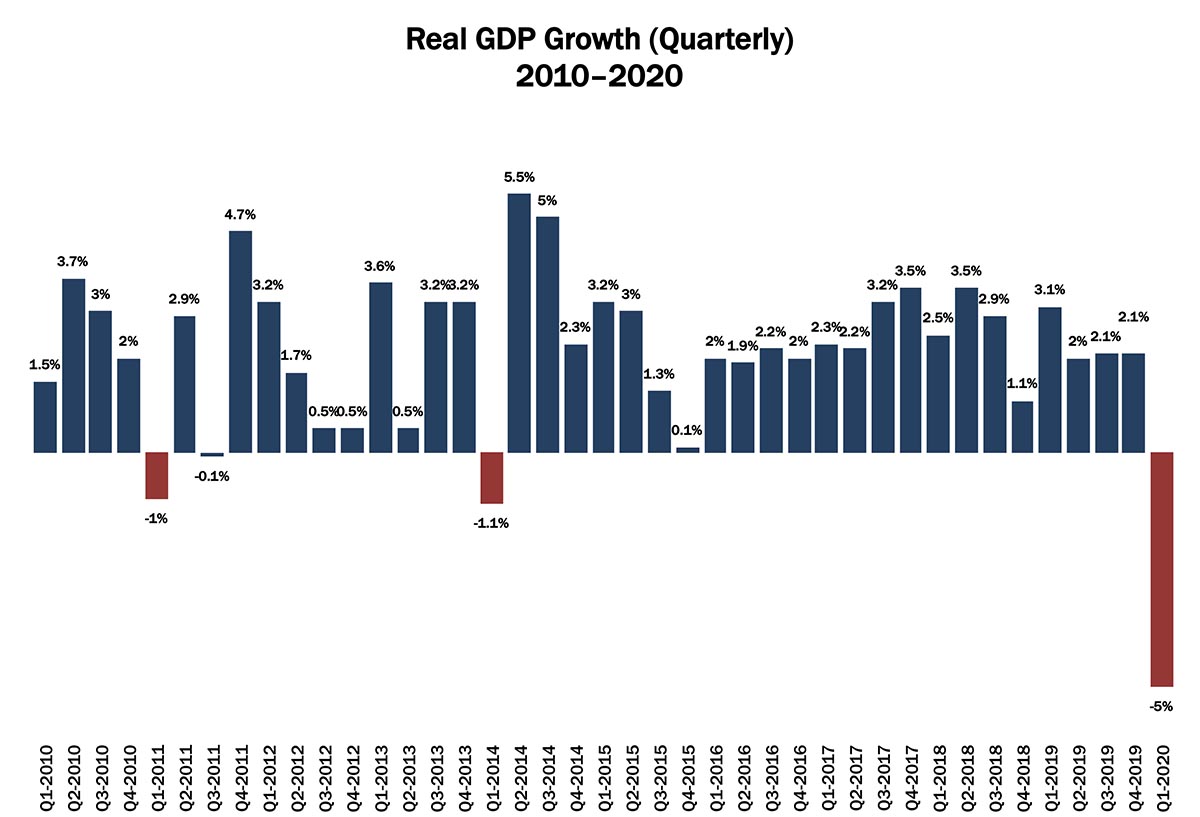
Source: Bureau of Economic Analysis


