Is it possible to know the footprint of direct mail? Steve Falk, president of Prime Data, a high-volume direct mail house in Aurora, Ont., decided to find out.
With the goal of making Canada-based Prime Data the first carbon-neutral direct mail housein the world, Falk engaged with Luke Battcock, a researcher who conducts GHG inventory development and carbon footprint analysis, to determine Prime Data’s carbon footprint and where those emissions are coming from. The study included analysis of the carbon footprint of Canada’s direct mail industry overall so Falk could see how his own company fit into the larger picture.
Falk revealed the conclusion of the study in his webinar “Carbon Neutral Direct Mail Now!” and discussed how his company worked with Battcock to come up with these numbers. He also opened his process to other printers to do the same. During the 30-minute session, Falk and Battcock walked through the research and invited their peers in the United States and Canada to view their results, use their methodology, and come up with their own analyses in order to identify where and how best to reduce their own impact.
Prime Data produces millions of pieces of direct mail each year, most of which are simple letters going into envelopes for the purpose of nonprofit fundraising.
Understanding the Components
Why is this important? First, we are global citizens. This earth is the only one we’ve got. Global warming is disrupting the delicate balance of our climate, our ecosystems, and all of the life that depends on them. If we can make a difference, why shouldn't we try? Second is the demand from clients, who are increasingly concerned about sustainability in their sourcing. The ability of printers to know their carbon footprints and show that they are reducing them creates a real competitive advantage.
The issue of carbon footprints is of particular concern to Falk as a Canadian, since on per-capita basis, Canadians are heavy emitters. “While with all of its vast forestlands and unpopulated spaces, Canada may rank lower than other countries in terms of overall GHG production,” he explains, “but when compared to countries with similar populations, Canada is actually at the top, with 14.2 tons of GHGs produced per capita. This is almost triple that of China, which has 5.0 tons produced per capita.”
(For the sake of comparison, the United States has a per-capita GHG production of 13.8 tons.)
Source: Prime Data webinar “Carbon Neutral Direct Mail Now!”
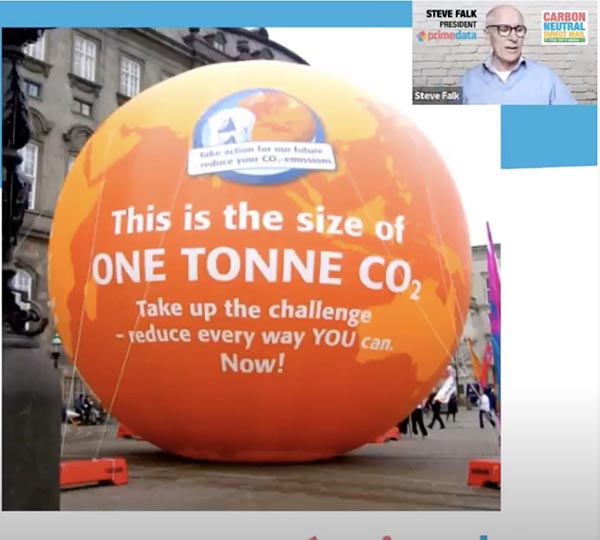
Can we take these numbers and correlate them to something that we can relate to? Falk put up a slide showing what a ton of CO2 looks like—like this giant orange ball 10 meters across. In other words, for every ton of CO2, this is the space it takes up. “In Canada, each person generates 14.2 of those bubbles into the atmosphere every year,” he says. (This means that, in the United States, each person generates 13.8 of them.)
Next, Falk presented the GHGs for Canada at large. Canada creates 738 megatons of greenhouse gases. That is 738 million of those orange balloons. (In the United States, we produce 6,558 megatons, or 6,558 million of them.)
Source: Prime Data
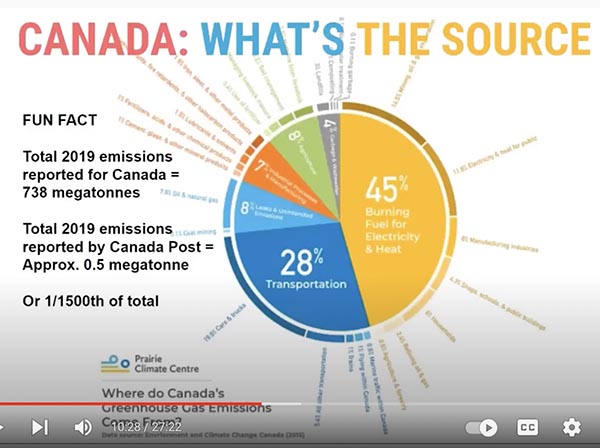
Falk then put up a slide showing the breakdown of the sources of Canada’s CO2 emissions. The single biggest factor, it turns out, is fuel for electricity and heat, at 45%. Coming in second is transportation, at 28%. This is followed by logistics, such as coal mining, oil, and natural gas harvesting/refining at 8%; agriculture at 8%; and industrial and manufacturing (including print production) at 7%.
This gives us some idea of how to start thinking about CO2 emissions in our own businesses. “You might think that, to reduce your carbon emissions, you’ll change all of your bulbs to LED bulbs, for example,” notes Battcock. “That is an important factor, but it’s not the highest impact factor. For the highest impact, you should typically look to your heating and cooling.”
Your carbon emissions for heating and cooling will vary based on where your business is based (to know for sure, this is the benefit of a GHG analysis). In Canada, the percentage of fuel used for electricity and heat varies by province. Battcock notes that, in Nova Scotia, for example, electricity comes mostly from coal. In Quebec, it is generated from 100% from hydropower. In Ontario, there is a mix of hydro, renewables like wind and solar, and nuclear.
(In the United States, the EPA reports that most of the CO2 emissions come from burning fossil fuels for energy use, as well, including coal, natural gas, and petroleum. As in Canada, the exact percentage will vary based on region. If you want to see which states have the highest and lowest carbon emissions, you can check them out here. )
Emissions for the Direct Mail Sector
Bringing all of this back to the direct mail sector, what portion of this can be attributed to direct mail specifically? To determine this, Battcock’s divided the mail journey into sectors. This allowed him to assess the emissions of each.
These sectors include:
- Forestry
- Paper production
- Printing
- Distribution
- End-of-life processing
“One of the nice things about our industry, and why direct mail isn’t so hard to understand, is its simplicity,” says Falk. “If we were to produce, say, toothpaste instead of direct mail, we’d have probably 25 products inside the tube to account for. To come up with a carbon footprint, we’d have to understand the individual carbon footprints of each one. In our business, we have [paper, ink, and coatings]. Compared to other businesses, print and direct mail are pretty straightforward.”
Also simplifying the process is that the paper industry, which is the largest emitter in the direct mail eco-system, has done a great job of calculating its own emissions. Canada Post provides emissions data, and other sectors can be estimated, a process that Battcock is continually refining.
Ultimately, according to Battcock, the answer is that direct mail contributes 1/1500 of the total emissions produced by Canada.
With this knowledge, what is the individual responsibility of each business to do what they can? “When you look at all of the emissions produced here in Canada, you might think, ‘There’s nothing I can do to make a significant impact on that,’” concludes Falk. “But when you look at the portion that is just direct mail—that 1/1500—you can. There, the changes that each one of us makes can have a significant impact on our industry’s portion of it.”
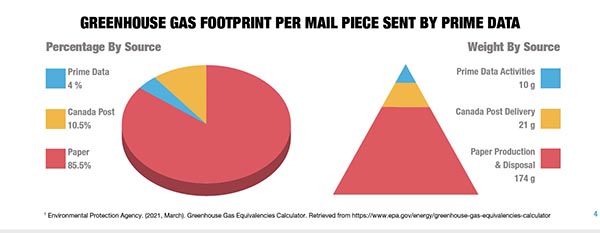
This is why Falk is so excited about the carbon footprint study conducted on behalf of Prime Data. “A year ago, it was anyone’s guess what the carbon footprint of a letter and envelope were,” he says. “With the study results, we better understand that impact, including the individual impacts of the paper, production, and delivery to mailboxes. With that knowledge, we have been able to take the first step and start a carbon offset program while, at the same time, reducing our carbon footprints where we can.”
I’ll discuss Prime Data’s carbon footprint and how it is using this information to reduce its GHGs in a future article. In the meantime, Falk invited attendees to join the Sustainable Mail Group, both through its website and its LinkedIn group, to magnify the power of printers to improve the sustainability of the industry by working together.