With 70–80% of a buyer’s journey already complete before they hit your website, how does your site stack up against others? This is a question we are used to having asked of clients, but it applies equally to printers, too. Once potential clients, whether print buyers, designers, or individual businesses, hit your site, do they get drawn in? Or do they bounce? Is it an experience that draws them back? Or is it once and done? From this perspective, Contentsquare’s 2022 Digital Experience Benchmark Reportoffers some helpful insights.
The 2022 Digital Experience Benchmark Report is a treasure trove of information. To create the report, Contentsquare analyzed over 100 data points from over 46 billion user sessions from around the globe. Data was drawn from 3,870 websites, in 14 industries, between January 1, 2021, and December 31, 2021.
How Are Buyers Finding You?
The first area of analysis is site entry. Contentsquare looks at three areas that every business should track:
- Where are my site visitors coming from?
- Are they new or returning customers?
- What devices are they using?
These metrics tell you whether your marketing efforts are effective, how your customers are finding you (online searches, content marketing, marketing initiatives), and whether your content and overall website experience are enough to draw them back. It also provides insight into how to prioritize your content for different platforms. Mobile continues to dominate, but notably, its share is 9% lower than last year—58% of traffic compared to 64%. If you’re wondering about this split from a client perspective, the mobile/desktop split (the percentage of tablet traffic remains minimal) varies by industry. Luxury goods has the highest mobile traffic at 76%, while financial services and consumer electronics have the lowest (37% and 45%, respectively).
What about new vs. returning users? Across all industries, 51% of traffic was made up of returning users. Pharmaceuticals and luxury goods had the highest percentage of returning customers (56% and 59%, respectively).
Notes the report:
The online marketplace is heavily saturated and today’s shopper has more choice than ever before; just because [customers] shopped with you once doesn’t mean they won’t go elsewhere for a better experience next time. And that first visit to your site is often make or break.
Respect Their Time
What is one of the keys to keeping customers coming back? Respecting their time by “offering seamless and intuitive journeys that help users reach their goals faster.” According to Contentsquare, buyers spend only 55 seconds per page across all industries, and each session averages 4 minutes and 17 seconds, so those experiences better be good. This includes load times. Average loading time by page on a mobile browser was 1.52 seconds. On desktop, it was 1.61 seconds.
Notes Ninya Noneva, senior solution expert for Contentsquare: “With people all over the globe suffering from online conference call fatigue and seeking to reduce their time behind screens, every second of user attention and engagement counts. Slow loading times are outside of the tolerance threshold of today’s busy, attention-deficient user. Customers expect website experiences that make it worth their while.”
Indeed, Contentsquare cites data from the Aberdeen Group that found that every one-second delay in page load time translates into a 16% decrease in customer satisfaction.
If customers are used to these kinds of experiences in a B2C setting, how does this translate to doing business with you? Do their expectations change just because they are sitting behind their desks at work rather than at home (did you know that 53% of U.S. consumers admit to using their smartphones to shop while in bed)? How much time do printers really spend thinking about their customers’ website experience? I’ve seen some pretty awful websites that were poorly written, difficult to navigate, and rarely updated. As important as this window is into your business for both new and returning customers, this is an area that deserves more attention than it often gets.
Make Traffic Organic
Where is website traffic coming from? According to this analysis, 75% of traffic came from earned (or unpaid) traffic across all industries. (Hence the emphasis on content marketing in all industries, including printing.) Whether in the world of B2B or B2C, the power of earned traffic is in the power of authenticity. People trust people (or other buyers) more than they do businesses, so they put a lot of stock in word of mouth or online content, mentions, recommendations, and shares, as well as what they can glean from the content on your website.
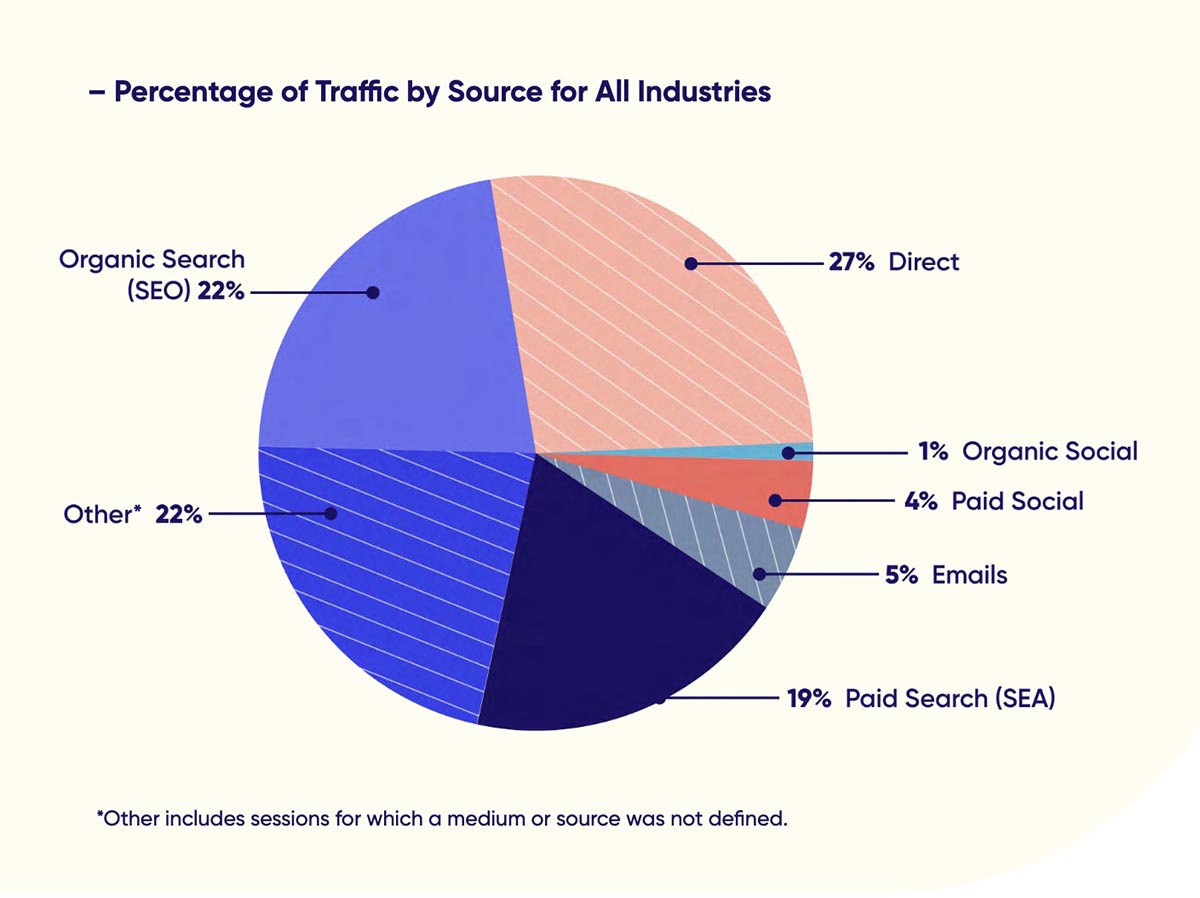
Source: Contentsquare
Interestingly, the percentage of paid traffic is up from 20% the prior year. The highest percentage of paid traffic is coming from the pharmaceuticals industry (44%) and the lowest from financial services (9%). But is that traffic actually translating into higher sales? Even as the percentage of paid traffic is up, 70% of online marketers say that SEO is more effective than pay-per-click (PPC) for generating sales.
Report Takeaways
A couple of takeaways from this data, according to Contentsquare:
First, don’t neglect the desktop. Despite the drumbeat that mobile would take over everything, it hasn’t. Second, invest time and resources into the entire customer lifecycle. Cater to your returning visitors as much as your newcomers. Consider not only your discovery experience, but also your onboarding experience. Buyers may love what you have to offer, but if you’re difficult to do business with online, it will be a challenge to retain them.
This only scratches the surface of the great insights in this benchmark report. If your customers’ website experience matters to you (or if you want to guide your customers in how their website experience matters to their customers), it’s worth checking out.
Download a copy here.