The business headlines about the October employment report may have said “unemployment rate falls to 4.9%; payrolls grow +161,000,” but the details of the overall employment picture deteriorated. We have reported the contraction in durable goods orders and manufacturing shipments has been going on for nearly two years, indicating a slowing economy.
For clues as to the overall health of the economy, we have to look at total employment, not just payrolls. To oversimplify, payroll employment is the number of jobs that get a W-2 form at tax time. That means that people can have more than one W-2 wages and taxes report if they have more than one job. If you have more than one job, the payroll employment counts multiple jobholders for each job.
The household survey, however, counts workers, not jobs, including self-employed and freelance workers. This is the report that is used to calculate the unemployment rate.
Did the unemployment rate go down? Yes, it did, but the number of employed people decreased by -43,000!
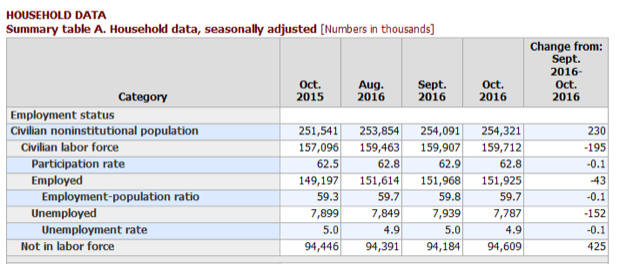
This is the table from the Bureau of Labor Statistics:
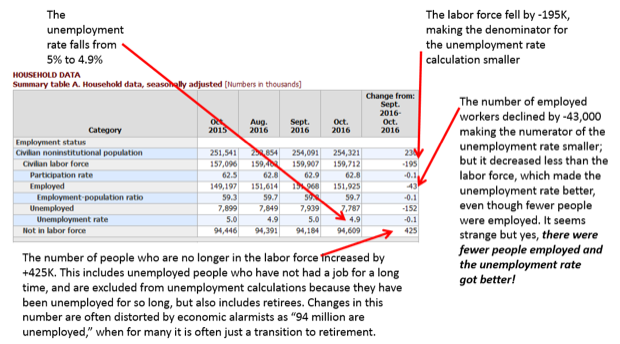
This is an explanation of it:
The bottom line is that these new data should be compared to last year at this time to see where we are. In those twelve months, the civilian labor force has increased by 2.6 million people (+1.7%) and the number of employed people is up by 2.7 million people (+1.8%). Those no longer in the labor force is up only 163,000 since last year, just a +0.2% change. This unemployment report should be considered disturbing, and possibly indicative of an unfolding recession, but the changes since last year are minimal, and it reinforces the idea of a sluggish economy.
One other aspect of the report is of concern: full time employment fell by -103,000, and part time employment was up by +90,000. This report covers the period prior to the new rates for health coverage being released, and that may cause employers to shift their mix of part time and full time workers in coming months.


