We continue our look at annual payroll in the printing industry.
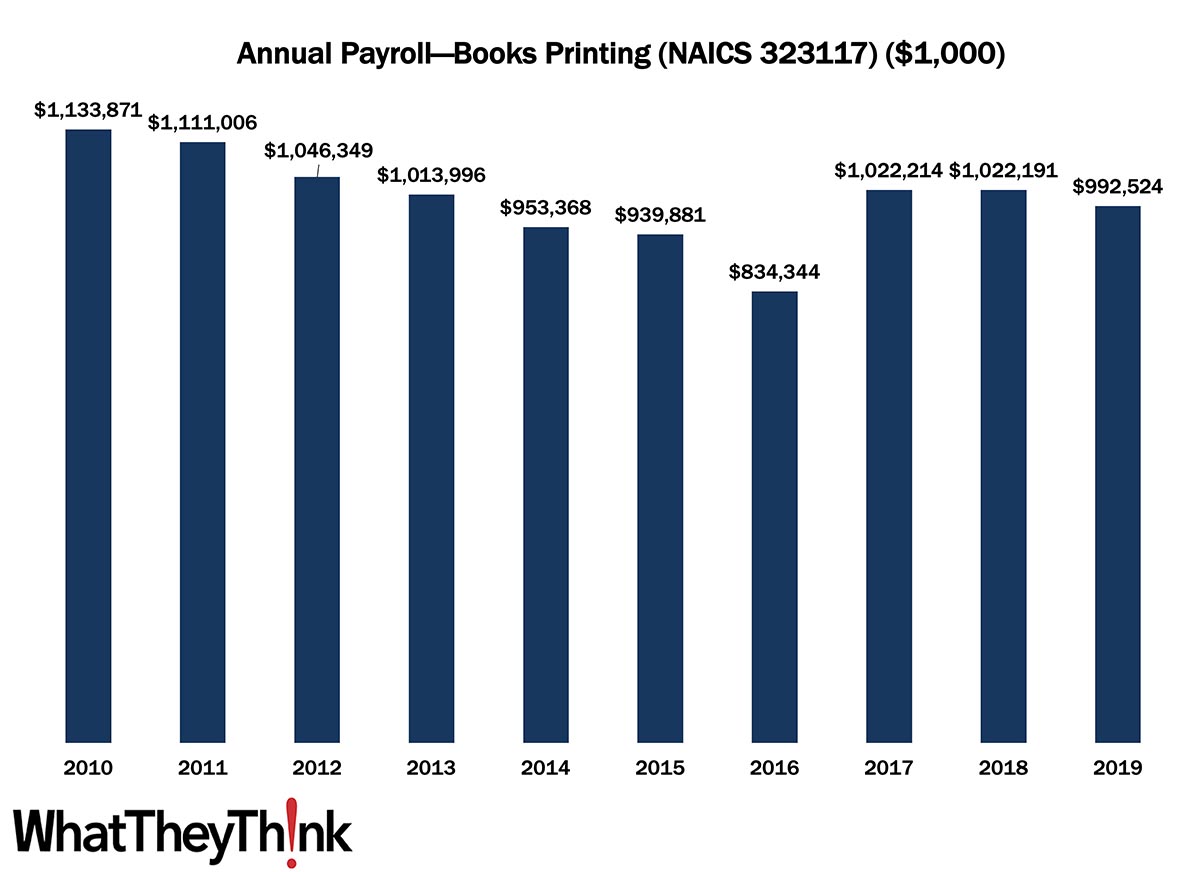
In 2010, US book printing establishments had an annual payroll of $1.1 billion. Payrolls declined over the first half of the 2010s, at least on a current dollar basis, but rose slightly as the decade drew to a close, finishing out the 2010s at $993 million in 2019. Note that County Business Patterns payroll data are reported in current, not inflation-adjusted, dollars. If we were to adjust for inflation, 2010 payroll would be equivalent to $1.3 billion in 2019, so we are essentially looking at an overall decline of -25% in payroll over the course of the decade. This is likely almost entirely due to industry consolidation—or to book printers diversifying into general commercial printing or other NAICS categories—as establishments and employees both declined by 25% as well.
Coming up next in this data series:
- 32312 (Support Activities for Printing—aka prepress and postpress services)
These data, and the overarching year-to-year trends, like other demographic data, can be used not only for business planning and forecasting, but also sales and marketing resource allocation.
This Macro Moment
The latest edition of Calculated Risk’s “State of the Real Estate Market” newsletter provides an overview of what has been a turbulent market. If you have spoken to a realtor lately, you know that home sales have started dropping as the increase in mortgage rates has started to kick in. From a low of under 3% back in July 2021, 30-year mortgage rates climbed and have only recently stabilized around 5.5%. As a result, says the NAR, existing home sales were at “a seasonally adjusted annual rate of 5.61 million in April. Year-over-year, sales dropped 5.9% (5.96 million in April 2021).” And sales of new single?family houses in April 2022, says the Census Bureau, “were at a seasonally adjusted annual rate of 591,000…This is 16.6 percent below the revised March rate of 709,000 and is 26.9 percent below the April 2021 estimate of 809,000.”
If you were buying and/or selling a home in the last two years, you know that house prices were going a bit nuts. Price reductions how now started to kick in, although being a new trend this has yet to show up in the data.
We have to be patient waiting to see the impact on house prices of the slowdown in sales due to the significant data lags. Meanwhile, Altos Research CEO Mike Simonsen noted this week that “prices reductions” are the story right now.
Meanwhile, house inventory is very low.
The NAR reported inventory was down 10.4% year-over-year in April. Since then, other sources, such as Altos Research and Realtor.com, indicate active inventory was up year-over-year in May. I expect the local market reports will show inventory up year-over-year in May too.
As for construction:
For new homes, there are 5.9 months of homes under construction - well above the normal level. This elevated level of homes under construction is due to supply chain constraints. This is close to the record set in 1980. However, there are still very few completed homes for sale.
And for housing starts there are a record 1.641 million units under construction. This eclipses the previous record of 1.628 million units that were under construction (mostly apartments in 1973 for the baby boom generation).
So what’s happening in real estate? Expect continued price reductions (great news if you’re looking to buy, not so great if you’re looking to sell), more inventory, and a continued slowdown in sales. Further impacts on real estate will also depend on whether the Fed will continue to raise interest rates if inflation stays high.


