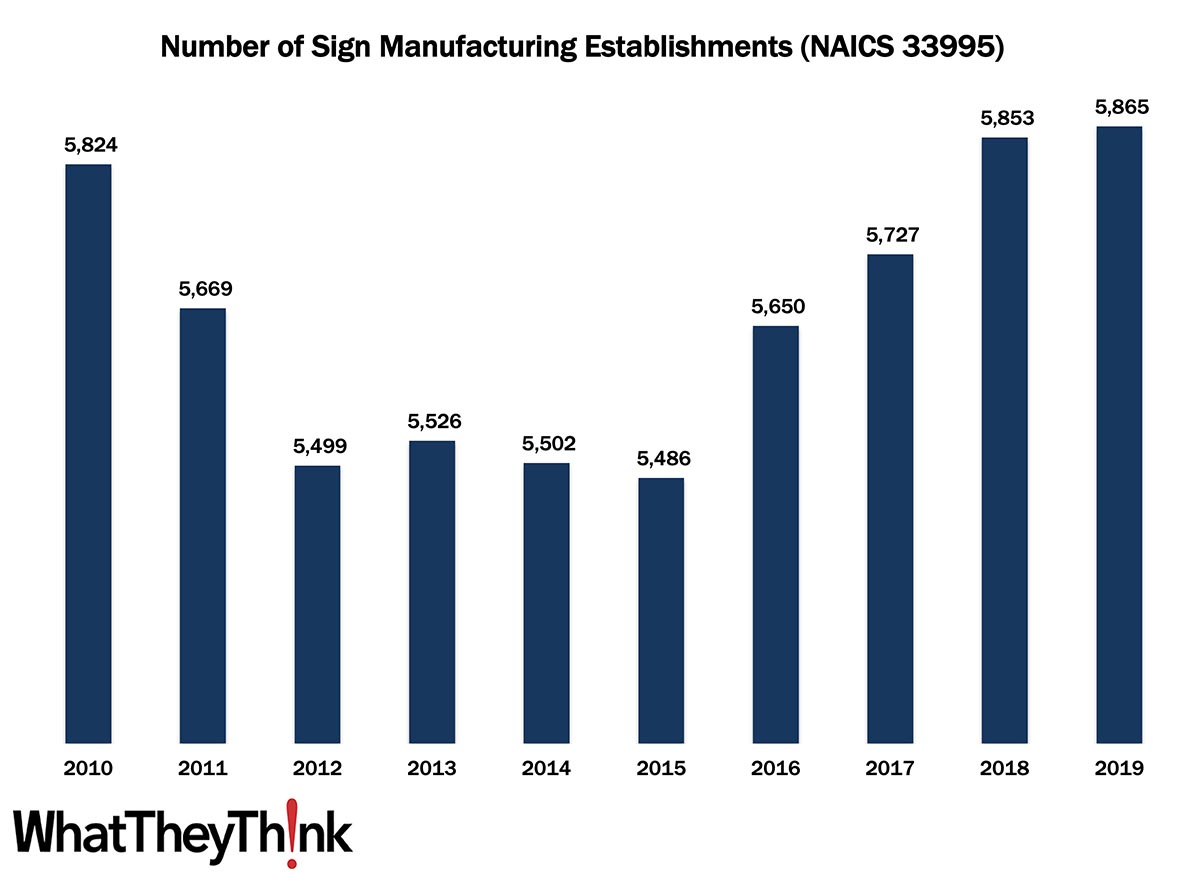
According to County Business Patterns, in 2010, there were 5,824 establishments in NAICS 33995 (Sign Manufacturing). Establishments in this NAICS category declined in the wake of the Great Recession, ultimately climbing back up to 5,865 establishments in 2019.
The Bureau of the Census definition for this business classification:
This industry comprises establishments primarily engaged in manufacturing signs and related displays of all materials (except printing paper and paperboard signs, notices, displays).
During and in the immediate aftermath of the Great Recession, there was decreased demand for signage, which didn’t reverse itself until new business began forming as the economy improved, and existing companies underwent a rebrand. By the end of the decade, rebrand cycles were shorter, while at the same time consolidation in verticals such as healthcare and banking drove up the demand for new signage projects. The years preceding the pandemic saw a lot of busines expansion, with chains opening new locations. All these trends drove up the demand for signage, which in turn drove up the number of providers of signage.
Next up in our data slice’n’dice series:
- NAICS 541850 Display/Outdoor Advertising
This Macro Moment
Ugh. Yesterday, January CPI figures were released. Said the BLS:
The Consumer Price Index for All Urban Consumers (CPI-U) increased 0.6 percent in January on a seasonally adjusted basis, the U.S. Bureau of Labor Statistics reported today. Over the last 12 months, the all items index increased 7.5 percent before seasonal adjustment.
Increases in the indexes for food, electricity, and shelter were the largest contributors to the seasonally adjusted all items increase. The food index rose 0.9 percent in January following a 0.5-percent increase in December. The energy index also increased 0.9 percent over the month, with an increase in the electricity index being partially offset by declines in the gasoline index and the natural gas index.
This was higher than economists were expecting.


