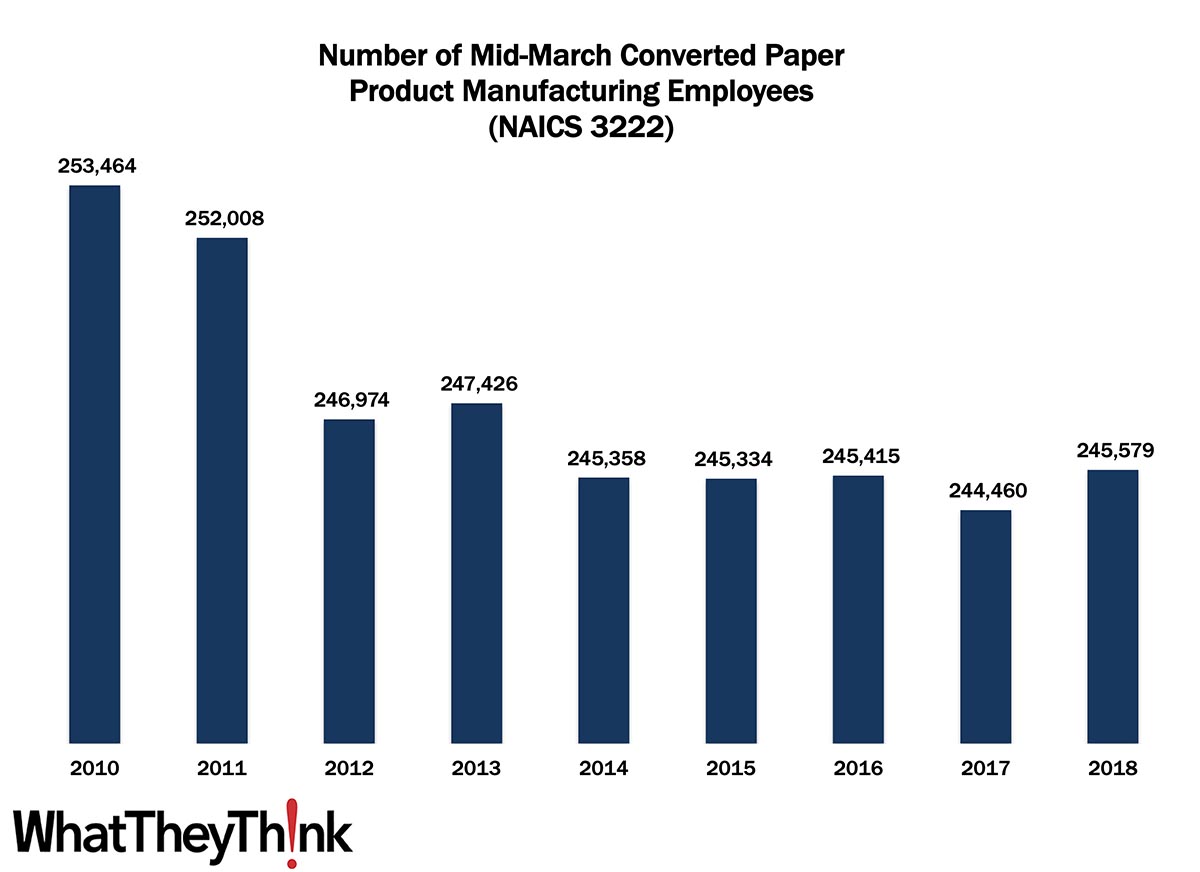
In 2010, there were 253,464 employees in NAICS 3222 (Converted Paper Product Manufacturing establishments). Employment in this category dropped abruptly in 2012, then remained somewhat stable over the course of the decade and reaching 245,579 in 2018. This 4-digit NAICS has a variety of disparate sub-categories:
- 32221 Paperboard Container Manufacturing
- 322211 Corrugated and Solid Fiber Box Manufacturing
- 322212 Folding Paperboard Box Manufacturing
- 322219 Other Paperboard Container Manufacturing
- 32222 Paper Bag and Coated and Treated Paper Manufacturing
- 32223 Stationery Product Manufacturing
- 32229 Other Converted Paper Product Manufacturing
- 322291 Sanitary Paper Product Manufacturing
- 322299 All Other Converted Paper Product Manufacturing
As we saw with our look at establishments in this category, different sub-categories have different market dynamics—corrugated and folding cartons vs. things like stationery vs. things like sanitary paper manufacturing—but if there is one constant across each of these categories it is consolidation. Especially in the period during and following the Great Recession (the first half of the decade), we saw no small amount of consolidation in all corners of the paper, converting, and printing industries.
As we dig deeper into the sub-categories in upcoming weeks, we can better identify the factors driving establishment growth and/or decline.
These data, and the overarching year-to-year trends, like other demographic data, can be used not only for business planning and forecasting, but also sales and marketing resource allocation.
This Macro Moment
The American Institute of Architects (AIA) released its monthly Architecture Billings Index (ABI) this week and it was good news:
The Architecture Billings Index (ABI) recorded its sixth consecutive positive month, according to a new report today from The American Institute of Architects (AIA).
The ABI score for July was 54.6. While this was down slightly from June’s score of 57.1, it still indicates very strong business conditions overall (any score above 50 indicates an increase in billings from the prior month). Scoring for new project inquiries also declined in July but remained near its all-time high at 65.0. The score for new design contracts was essentially unchanged from June to July with a score of 58.0.
The ABI had been below 50 for most of 2020 (quel surprise) but has been positive for the last six months. Said AIA’s Chief Economist Kermit Baker, Hon. AIA:
Five straight months of strong numbers, design contracts, and inquiries continue to break records, too. Six months ago, firm owners worried if they were going to make payroll or rent. They worried about the length of the downturn and if they’d survive. Now, they’re worried about hiring qualified employees fast enough, retaining key talent, and the logistics of moving forward with active projects.
Increased demand for architectural design services means new construction projects and ergo demand for new signage projects and installations.


