We are starting a new data series in our Friday Data Slice’n’Dice, again based on data from County Business Patterns: employees.
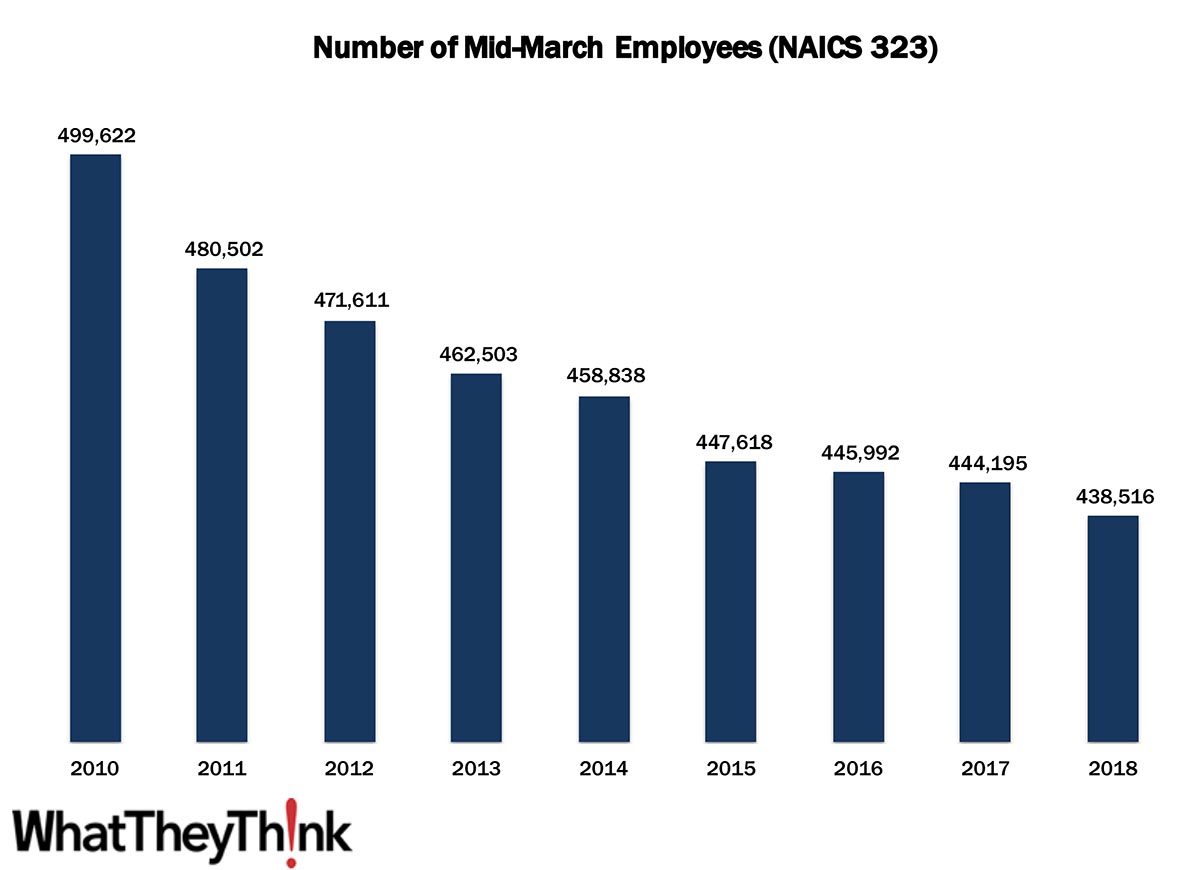
We start at the very beginning with our old friend NAICS 323 (Printing and related support activities). In 2010, there were 499,622 employees working in US establishments in NAICS 323. By 2018, that number had declined -12.2% to 438,516.
At least in the time period we are looking at here, the decline in industry employment is due to a number of factors:
Industry consolidation, especially in the early part of the decade, although employee declines are not solely a case of displaced workers being out on the street thanks to closures or consolidation, although there is some of that. In fact, ask any print business owner and they’ll tell you that finding employees is among their biggest challenges. So a lot of these declines are largely due to retirement and workers otherwise exiting the industry without a ready pool of next-generation employees waiting to be hired.
It’s also interesting that the automation trend runs in an opposite direction in our industry than in other industries. Usually, automation displaces current employees, such as in various kinds of industrial manufacturing businesses. In the printing industry, automation is increasingly being looked to as a solution to employees who have already been self-displaced.
These counts are based on data from the Census Bureau’s County Business Patterns. Every other week, we update these data series with the latest figures. Census Bureau reports include other data, as well, such as number of employees, payroll, etc. These counts are broken down by publishing business classification (based on NAICS, the North American Industrial Classification System). Over the next few months, we will be looking at:
- 32311 (Printing)
- 323111 (Commercial Printing, except Screen and Books)
- 323113 (Commercial Screen Printing)
- 323117 (Books Printing)
- 32312 (Support Activities for Printing—aka prepress and postpress services)
These data, and the overarching year-to-year trends, like other demographic data, can be used not only for business planning and forecasting, but also sales and marketing resource allocation.
This Macro Moment
Yesterday, the Bureau of Economic Analysis released Q4 2020 GDP. Said the BEA:
Real gross domestic product (GDP) increased at an annual rate of 4.0 percent in the fourth quarter of 2020, according to the "advance" estimate released by the Bureau of Economic Analysis. In the third quarter, real GDP increased 33.4 percent.
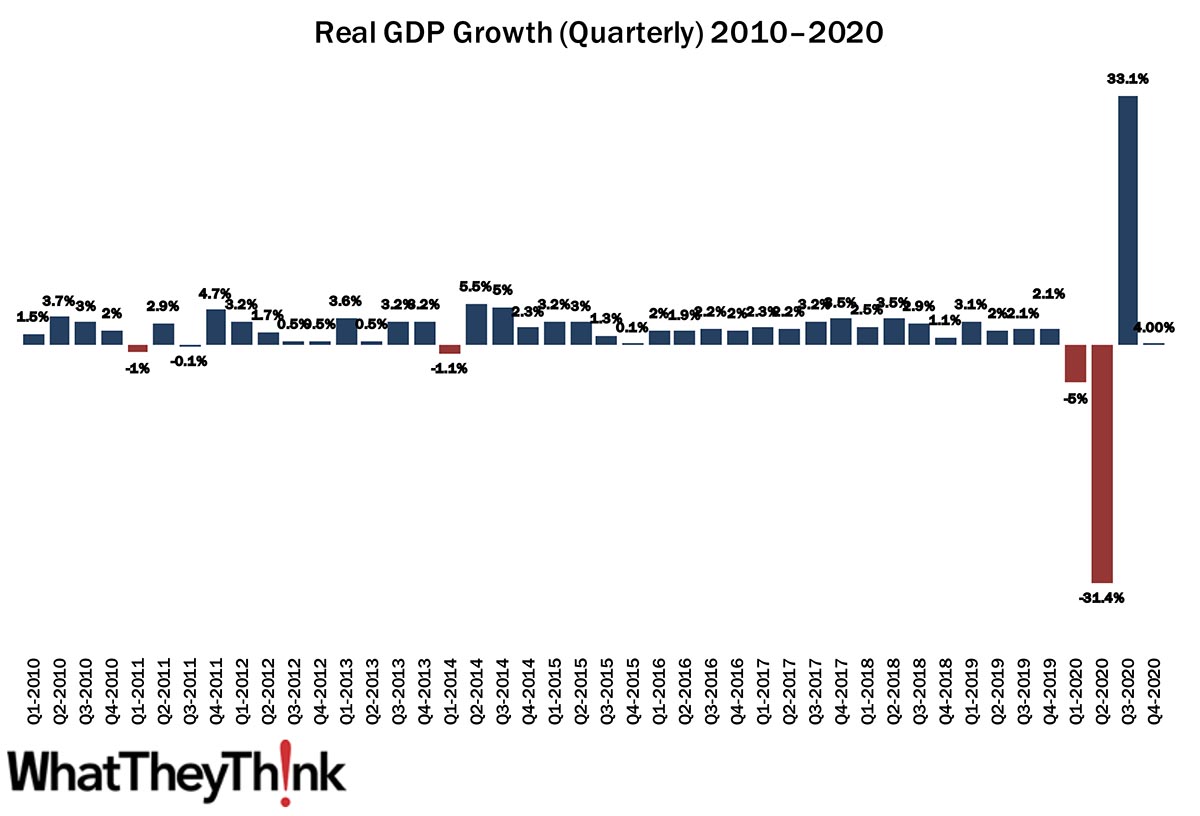
Source: Bureau of Economic Analysis.
For 2020 as a whole, real GDP decreased 3.5%, compared with an increase of 2.2% in 2019. “The decrease in real GDP in 2020 reflected decreases in PCE, exports, private inventory investment, nonresidential fixed investment, and state and local government that were partly offset by increases in federal government spending and residential fixed investment. Imports decreased.” Adds Calculated Risk, “This was the worst year since 1946 (WWII drawdown). And other than WWII drawdown, this was the worst year since the Great Depression.”


