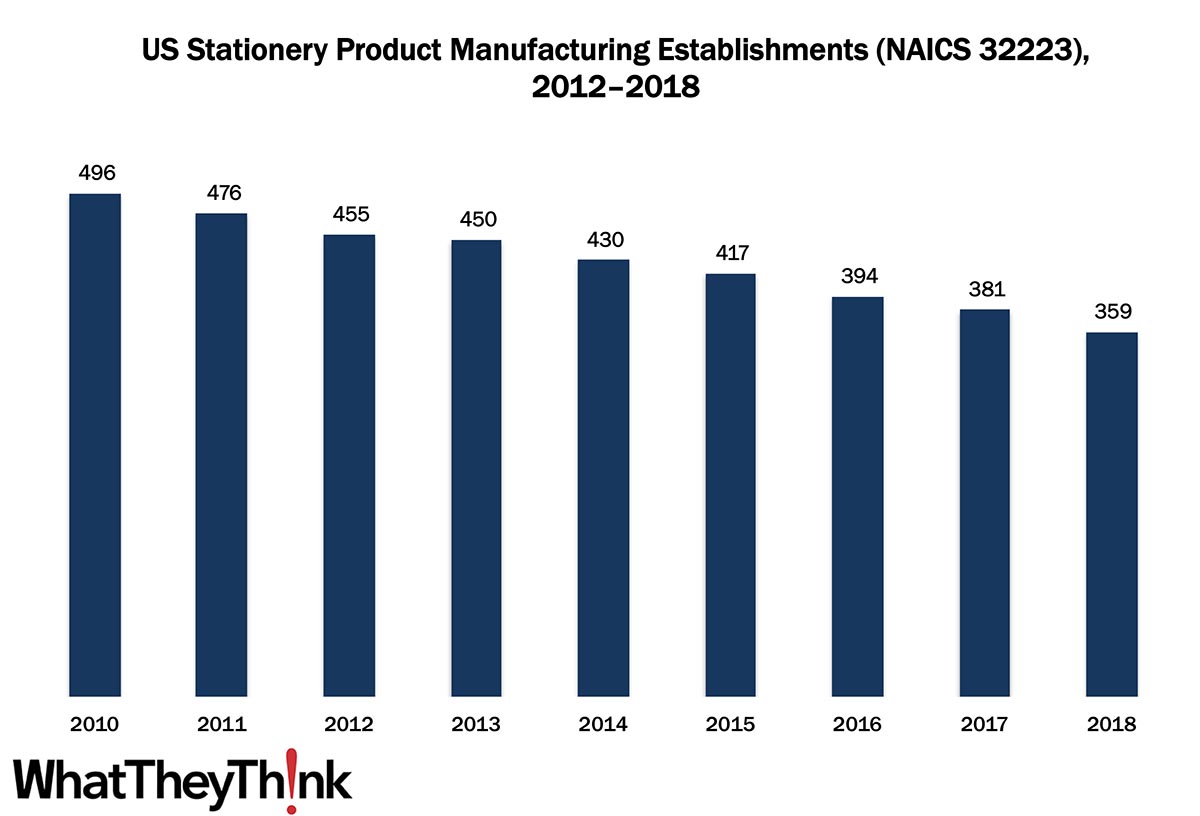
In our ongoing, semi-weekly look at establishment and employee counts of graphic arts businesses, we have been looking at packaging/paper converting establishments. In 2010, there were 496 establishments in NAICS 32223 (Stationery Product Manufacturing), and by 2018, that number had declined to 359.
The Bureau of the Census definition for this business classification:
This industry comprises establishments primarily engaged in converting paper or paperboard into products used for writing, filing, art work, and similar applications.
Although establishments in this category had been declining, it was around the time of the last few data points (~2016) that industry watchers had been noting a renewed interest in stationery and related products. Said Stationery Trends magazine in 2016: “There is a strong resurgence in consumers’ passion for stationery and specialty paper products. From journals to cards to prints, the written word and personal sentiments are returning stronger than ever—and in new ways.” Traditional print greeting cards remain fairly strong (a common theme of them has been ‘I got you a real card’) while LEDs, audio, and other electronic/rich media elements have made their way into printed greeting cards. The Greeting Card Association also tracked a heightened interest in hand-lettered greeting cards, unique shapes, foils, and other special effects.
Journals with unique uses also stand out, from blank journals, to travel diaries (remember when one could do that?), self-exploration journals, and journals that track family memories have been trending subjects. For fitness buffs, “workout diaries” (“WODBooks”) are also popular items. The classic Moleskine notebook had a resurgence mid-decade and pictures of note-filled Moleskines are shared on social media.[1]Christmas and other holiday cards are increasingly customized/personalized, featuring the sender’s family and printed via digital print services such as Shutterfly. “Hand-crafted,” often using letterpress, is often the operative term in much of this product category, although many of these “makers” may not be reflected in Census data, as they tend to be individual artisans or hobbyists. Although these data points are a few years old, I will be interesting to see in a few years what the pandemic and forced lockdowns have done to demand for these kinds of items.
These counts are based on data from the Census Bureau’s County Business Patterns. Every other week, we update these data series with the latest figures. Census Bureau reports include other data, as well, such as number of employees, payroll, etc. These counts are broken down by publishing business classification (based on NAICS, the North American Industrial Classification System).
These data, and the overarching year-to-year trends, like other demographic data, can be used not only for business planning and forecasting, but also sales and marketing resource allocation.
Over time, we will be adding additional data from County Business Patterns, such as number of employees, payroll, and similar information for additional business classification of relevance to the graphic communications industry.
This Macro Moment
Yesterday, we had a look at overall retail trends, but this week (some time after that article had been written) the Census Bureau released its monthly advance retail sales report. They said:
Advance estimates of U.S. retail and food services sales for November 2020, adjusted for seasonal variation and holiday and trading-day differences, but not for price changes, were $546.5 billion, a decrease of 1.1 percent (±0.5 percent) from the previous month, but 4.1 percent (±0.7 percent) above November 2019. Total sales for the September 2020 through November 2020 period were up 5.2 percent (±0.5 percent) from the same period a year ago. The September 2020 to October 2020 percent change was revised from up 0.3 percent (±0.5 percent) to down 0.1 percent (±0.2 percent).
Retail trade sales were down 0.8 percent (±0.5 percent) from October 2020, but 7.1 percent (±0.7 percent) above last year. Nonstore retailers were up 29.2 percent (±1.6 percent) from November 2019, while food services and drinking places were down 17.2 percent (±3.7 percent) from last year.
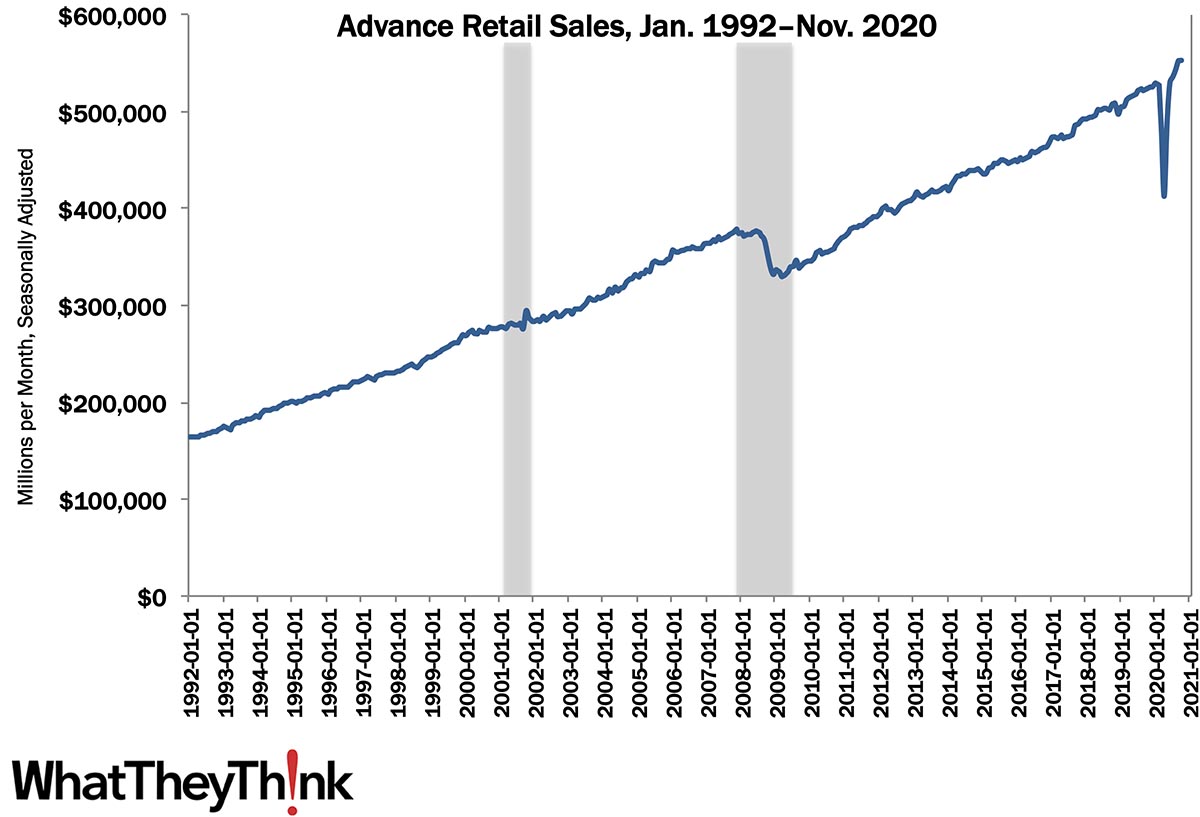
Source: Bureau of the Census. Shaded areas indicate recessions.
The holiday season this year seems like it will be fairly muted, and the arrival of winter and the banning of indoor dining in many places (like in the Northeast—where yesterday many places got dumped with several feet of snow) are causing eating and drinking establishments to take a beating. Online Christmas shopping may blunt the blow (we’ll see what the revision to the November data show) and perhaps December retail sales will be up as people put off whatever holiday shopping they had been planning. But absent some kind of disaster relief à lathe CARES Act way back in April (which as of this writing is getting closer to some kind of reality), a lot of small retailers are going to start off 2021 in very rough shape. That will of course trickle down to reduced demand for retail graphics.
That said, with the vaccine on its way, it’s a safe bet that many policies will be put in place regarding vaccination. For example, here’s one example of what that may look like. Early last month, Ticketmaster announced that it was working on a fan safety program for live events that will use a smartphone app to verify a concertgoer’s vaccination status or whether they've tested negative for the coronavirus within a 24- to 72-hour window. Said Billboard magazine:
Here's how it would work, if approved: After purchasing a ticket for a concert, fans would need to verify that they have already been vaccinated (which would provide approximately one year of COVID-19 protection) or test negative for coronavirus approximately 24 to 72 hours prior to the concert. The length of coverage a test would provide would be governed by regional health authorities -- if attendees of a Friday night concert had to be tested 48 hours in advance, most could start the testing process the day before the event. If it was a 24-hour window, most people would likely be tested the same day of the event at a lab or a health clinic.
Once the test was complete, the fan would instruct the lab to deliver the results to their health pass company, like CLEAR or IBM. If the tests were negative, or the fan was vaccinated, the health pass company would verify the attendee's COVID-19 status to Ticketmaster, which would then issue the fan the credentials needed to access the event. If a fan tested positive or didn't take a test to verify their status, they would not be granted access to the event. There are still many details to work out, but the goal of the program is for fans to take care of vaccines and testing prior to the concert and not show up hoping to be tested onsite.
If this goes through, it’s a safe bet that this kind of proof of vaccination/COVID status will be required for many other kinds of public spaces and events—and maybe even retail establishments, especially restaurants or bars. Regardless of how all this pans out, there will need to be signage and other graphics that communicate whatever an establishment’s prevailing policy is, much like what we saw with distancing and mask-wearing.
[1]David Sax, The Revenge of Analog, New York: PublicAffairs, 2016, p. 38.


