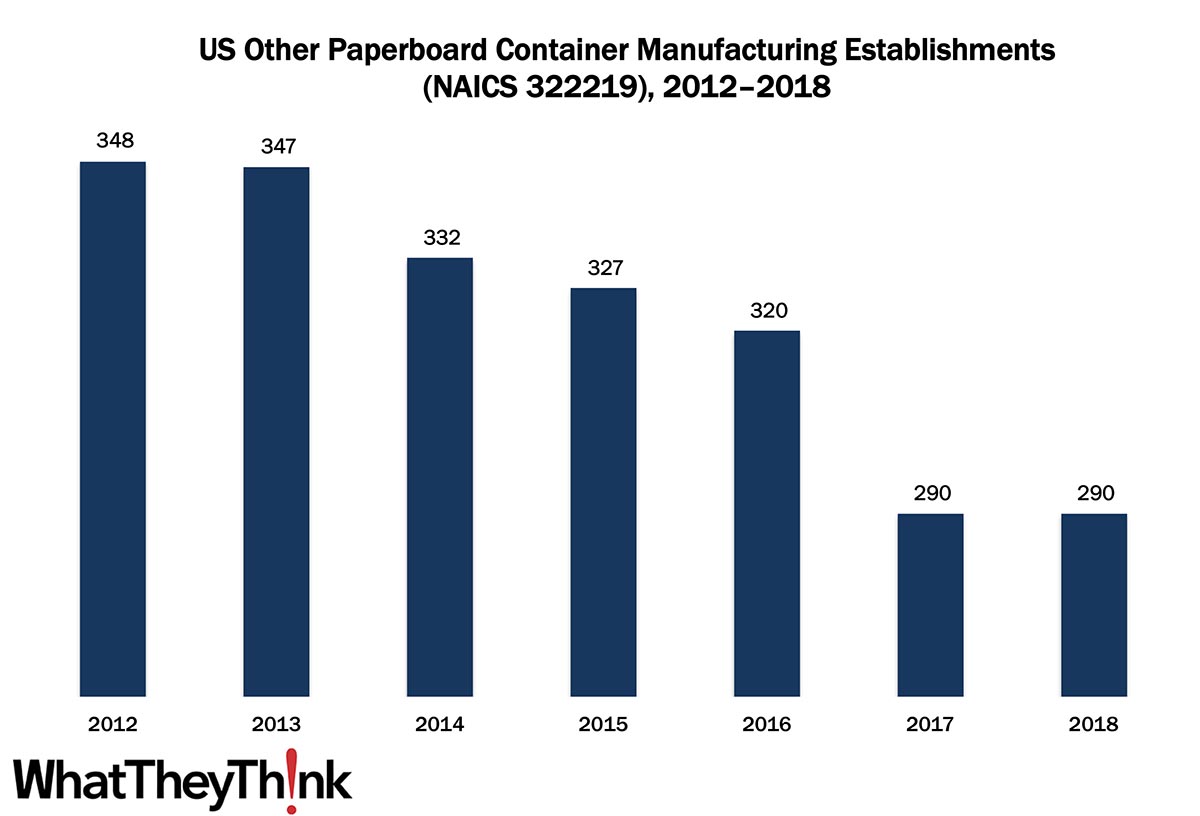
In our ongoing, semi-weekly look at establishment and employee counts of graphic arts businesses, we have been looking at packaging/paper converting establishments. In 2012, there were 348 establishments in NAICS 322219 (Other Paperboard Container Manufacturing), and by 2018, that number had declined to 290, unchanged on net from 2017 (there were growths and declines in some of the establishment size categories).
The Bureau of the Census definition for this business classification:
This U.S. industry comprises establishments primarily engaged in converting paperboard into paperboard containers (except corrugated, solid fiber, and folding paperboard boxes) without manufacturing paperboard.
As you may have guessed, this is a catchall category that rounds up all the businesses that don’t fit into 32221 (Paperboard Container Manufacturing). This NAICS was created in 2012 after the 2012 Economic Census, and was used to round up discontinued subcategories, such as setup paperboard box manufacturing; fiber can, tube, drum, and similar products manufacturing; and nonfolding sanitary food container manufacturing. Some of the products that are produced by establishments in this NAICS include fiber cans and drums (i.e., all-fiber, non-fiber ends of any material) made from purchased paperboard, milk cartons, sanitary food containers, and other forms of liquid packaging, such as that used to hold water, soft drinks, dairy products, and fruit juices.
We’ve got one category left in this four-digit NAICS, which we will look at in two weeks time:
- 32223 Stationery Product Manufacturing
These counts are based on data from the Census Bureau’s County Business Patterns. Every other week, we update these data series with the latest figures. Census Bureau reports include other data, as well, such as number of employees, payroll, etc. These counts are broken down by publishing business classification (based on NAICS, the North American Industrial Classification System).
These data, and the overarching year-to-year trends, like other demographic data, can be used not only for business planning and forecasting, but also sales and marketing resource allocation.
Over time, we will be adding additional data from County Business Patterns, such as number of employees, payroll, and similar information for additional business classification of relevance to the graphic communications industry.
This Macro Moment
This week, the Federal Reserve published its most recent “Beige Book” (aka “Summary of Commentary on Current Economic Conditions”), which is issued eight times a year. The Beige Book compiles more or less anecdotal information on economic conditions in each of the 12 Federal Reserve districts. Not quantitative, it is based on conversations with bank and branch directors and interviews with key business contacts, economists, market experts, and others. It is published as a prelude to Federal Open Market Committee meetings.
You can read the whole thing here, particularly the reports from your Fed district, but here are some selected comments. Note that it is based on information compiled before November 20, 2020.
Overall Economic Activity
Most Federal Reserve Districts have characterized economic expansion as modest or moderate since the prior Beige Book period [October 21]. However, four Districts described little or no growth, and five narratives noted that activity remained below pre-pandemic levels for at least some sectors. Moreover, Philadelphia and three of the four Midwestern Districts observed that activity began to slow in early November as COVID-19 cases surged. Reports tended to indicate higher-than-average growth of manufacturing, distribution and logistics, homebuilding, and existing home sales, although not without disruptions. Banking contacts in numerous Districts reported some deterioration of loan portfolios, particularly for commercial lending into the retail and leisure and hospitality sectors. An increase in delinquencies in 2021 is more widely anticipated. Most Districts reported that firms' outlooks remained positive; however, optimism has waned--many contacts cited concerns over the recent pandemic wave, mandated restrictions (recent and prospective), and the looming expiration dates for unemployment benefits and for moratoriums on evictions and foreclosures.
Employment and Wages
Nearly all Districts reported that employment rose, but for most, the pace was slow, at best, and the recovery remained incomplete. Firms that were hiring continued to report difficulties in attracting and retaining workers. Many contacts noted that the sharp rise in COVID-19 cases had precipitated more school and plant closings and renewed fears of infection, which have further aggravated labor supply problems, including absenteeism and attrition....
Prices
In most Districts, firms reported modest to moderate increases of input prices, while the selling prices of final goods rose at a slight to modest pace. Contacts noted that COVID-19 cases have caused ongoing disruptions and delays among short-staffed producers and shippers—raising transportation costs, which are then passed through to buyers.
It’s a jungle out there.


