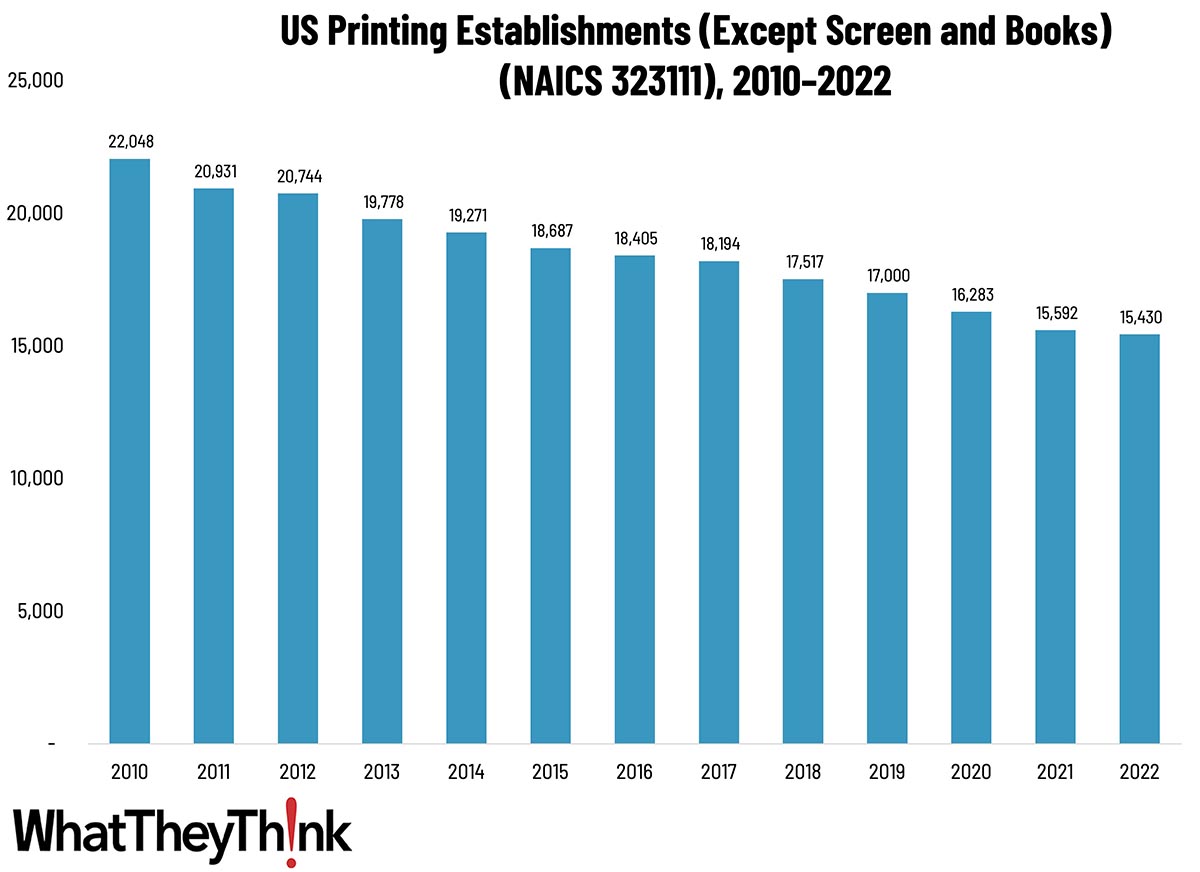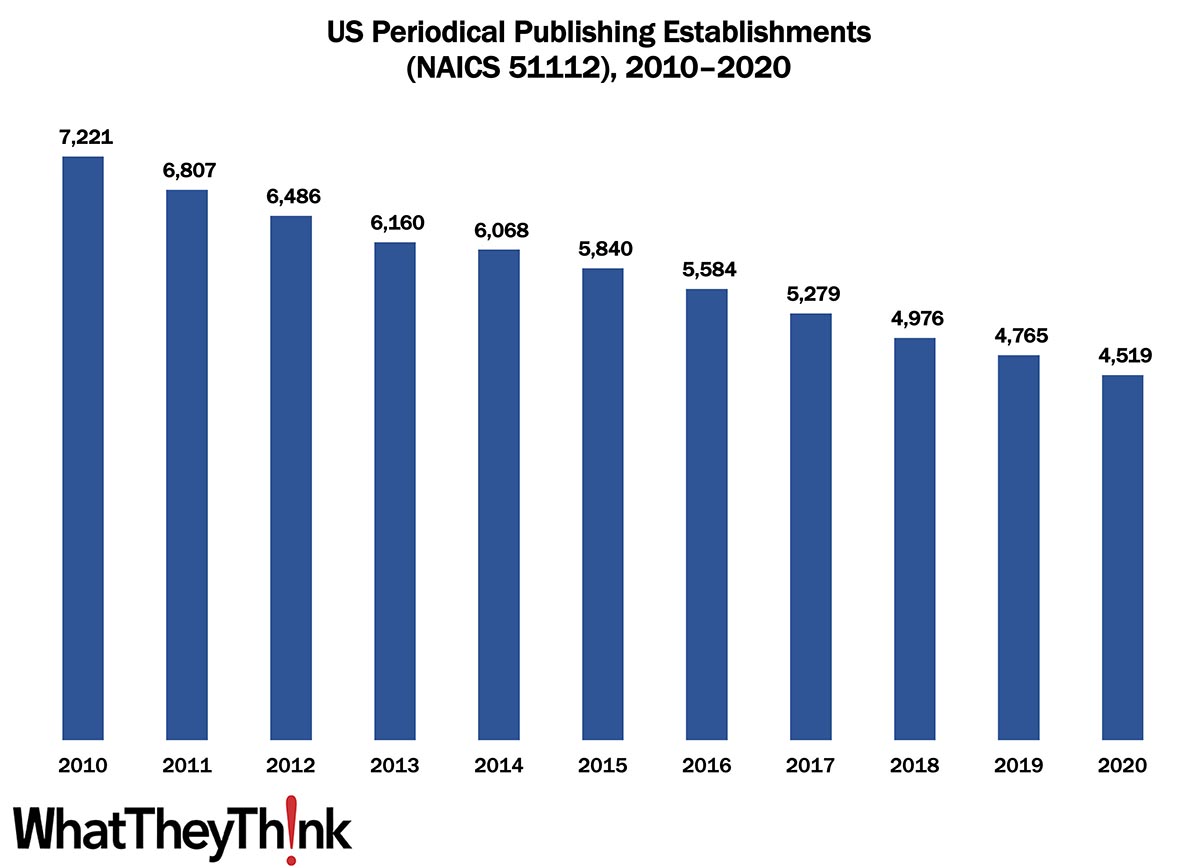
Our Friday data slice’n’dice look at the latest edition of County Business Patterns has been detailing the publishing industries. As 2020 began, there were 4,519 establishments in NAICS 51112 (Periodical Publishing), a decrease of 37% since 2010.
There is a lot going on with periodical publishing; some of it is bad, such as magazines and their publishers shutting down, or merging, or being acquired by other entities. (This was, of course, pre-pandemic.) But there could also be a labelling/identification issue that could be affecting these counts. Focusing on print ignores the fact that magazines are just as invested, if not more so, in their digital/online components. (One only has to look at the official trade association to get a sense of the changing times: once called the Magazine Publishing Association, some time ago it changed its name to the Association of Magazine Media and then, in July 2022, merged with the News Media Alliance, the name it goes by now.) If these periodical publishers subsequently see themselves as media companies, do they classify themselves in NAICS 51112? Also, Internet publishers, streaming media, and Web search portals have their own classification (NAICS 51913). So some of these establishment declines are very real and portend turmoil in the periodical publishing space, as publications lose circulation/readership as well as advertising (both physical and digital), but also reflect changes in what constitutes a “periodical publisher.”
To clarify what is included in the 2020 CBP, establishment counts represent the number of locations with paid employees at any time during the year. If an establishment existed at any point during the year, it would be included in the CBP count of the number of establishments for 2020 CBP. Thus, businesses lost during the COVID pandemic won’t be accounted for until the 2021 CBP.
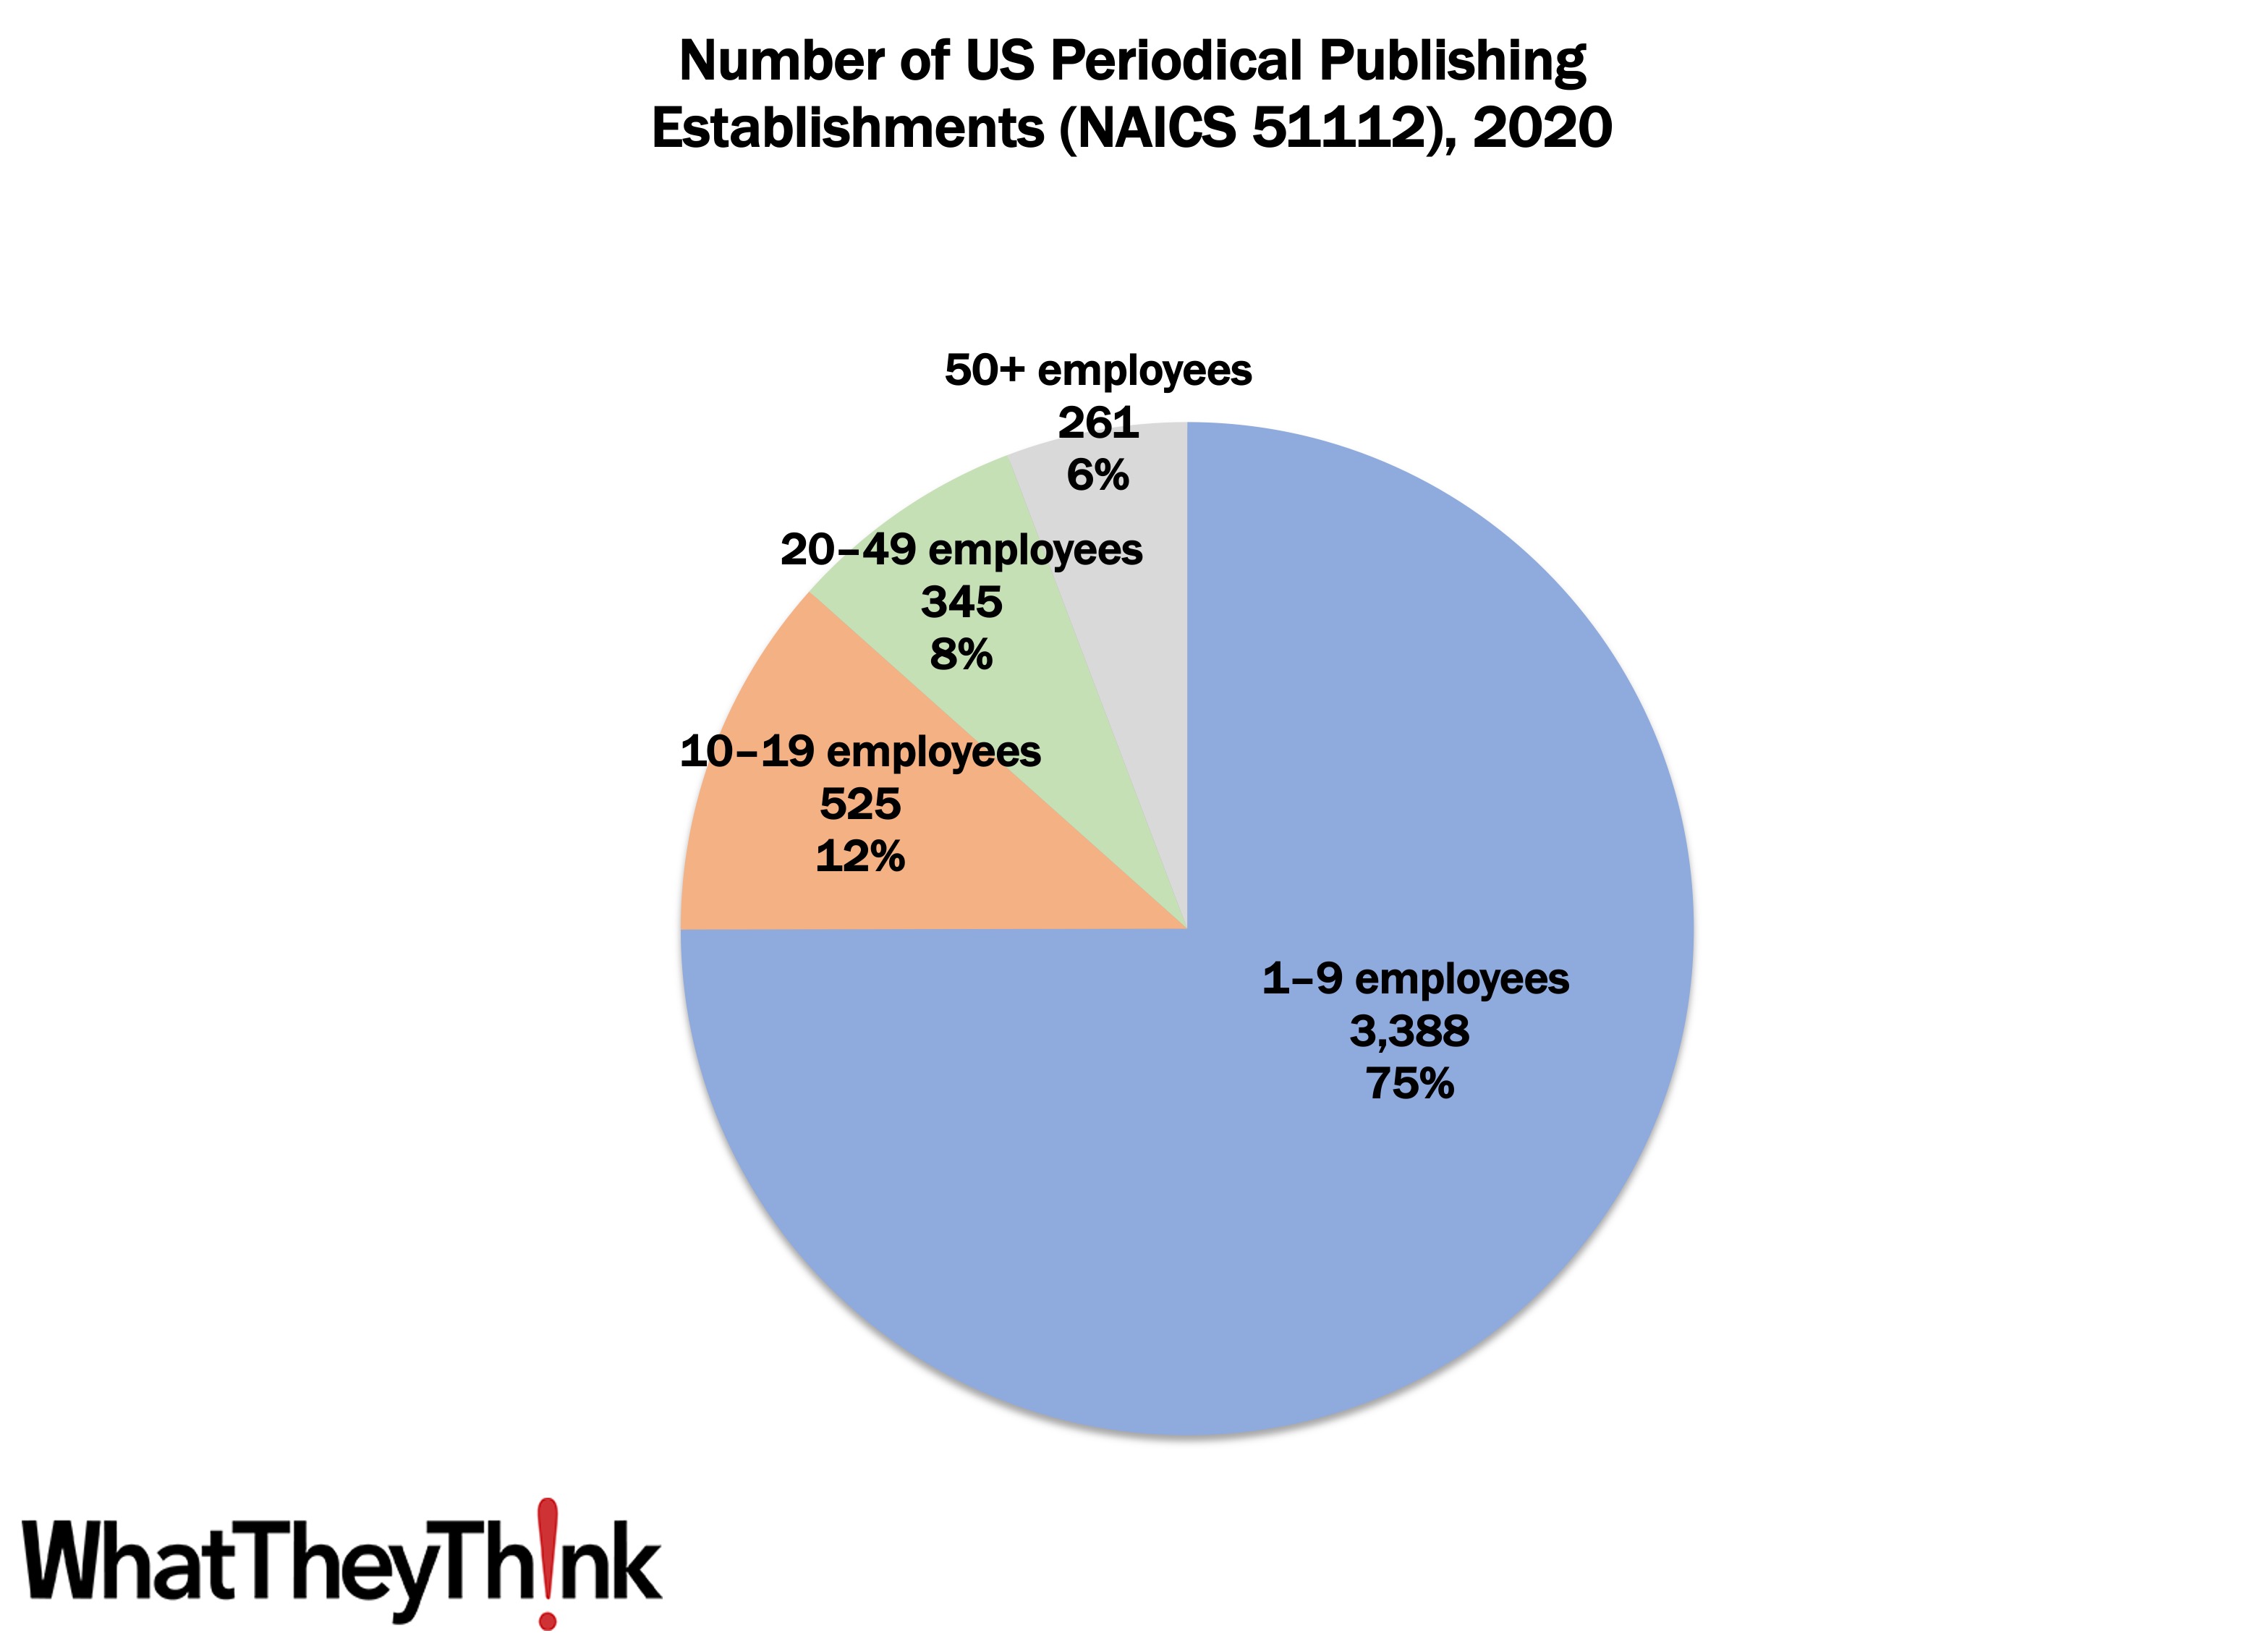
Publishing establishments are concentrated at the lower end of the employee-count spectrum. Small publishers (1 to 9 employees) comprise the bulk of the establishments, accounting for 75% of all establishments, with 10–19-employee establishments accounting for 12%, 20–49-employee establishments accounting for 8%, and 50+-employee establishments at 6%.
These counts are based on data from the Census Bureau’s County Business Patterns. Throughout this year, we will be updating these data series with the latest CBP figures. County Business Patterns includes other data, such as number of employees, payroll, etc. These counts are broken down by commercial printing business classification (based on NAICS, the North American Industrial Classification System). Up next:
- 51113 Book Publishers
- 51114 Directory and Mailing List Publishers
- 51119 Other Publishers
- 511191 Greeting Card Publishers
- 511199 All Other Publishers
These data, and the overarching year-to-year trends, like other demographic data, can be used not only for business planning and forecasting, but also sales and marketing resource allocation.
This Macro Moment…
Last week, the Bureau of Economic Analysis (BEA) released its advance estimate of third quarter GDP and it was quite good:
Real gross domestic product (GDP) increased at an annual rate of 2.6 percent in the third quarter of 2022 (table 1), according to the "advance" estimate released by the Bureau of Economic Analysis. In the second quarter, real GDP decreased 0.6 percent.
… The increase in real GDP reflected increases in exports, consumer spending, nonresidential fixed investment, federal government spending, and state and local government spending, that were partly offset by decreases in residential fixed investment and private inventory investment. Imports, which are a subtraction in the calculation of GDP, decreased (table 2).
The increase in exports reflected increases in both goods and services. Within exports of goods, the leading contributors to the increase were industrial supplies and materials (notably petroleum and products as well as other nondurable goods), and nonautomotive capital goods. Within exports of services, the increase was led by travel and "other" business services (mainly financial services). Within consumer spending, an increase in services (led by health care and "other" services) was partly offset by a decrease in goods (led by motor vehicles and parts as well as food and beverages). Within nonresidential fixed investment, increases in equipment and intellectual property products were partly offset by a decrease in structures. The increase in federal government spending was led by defense spending. The increase in state and local government spending primarily reflected an increase in compensation of state and local government employees.
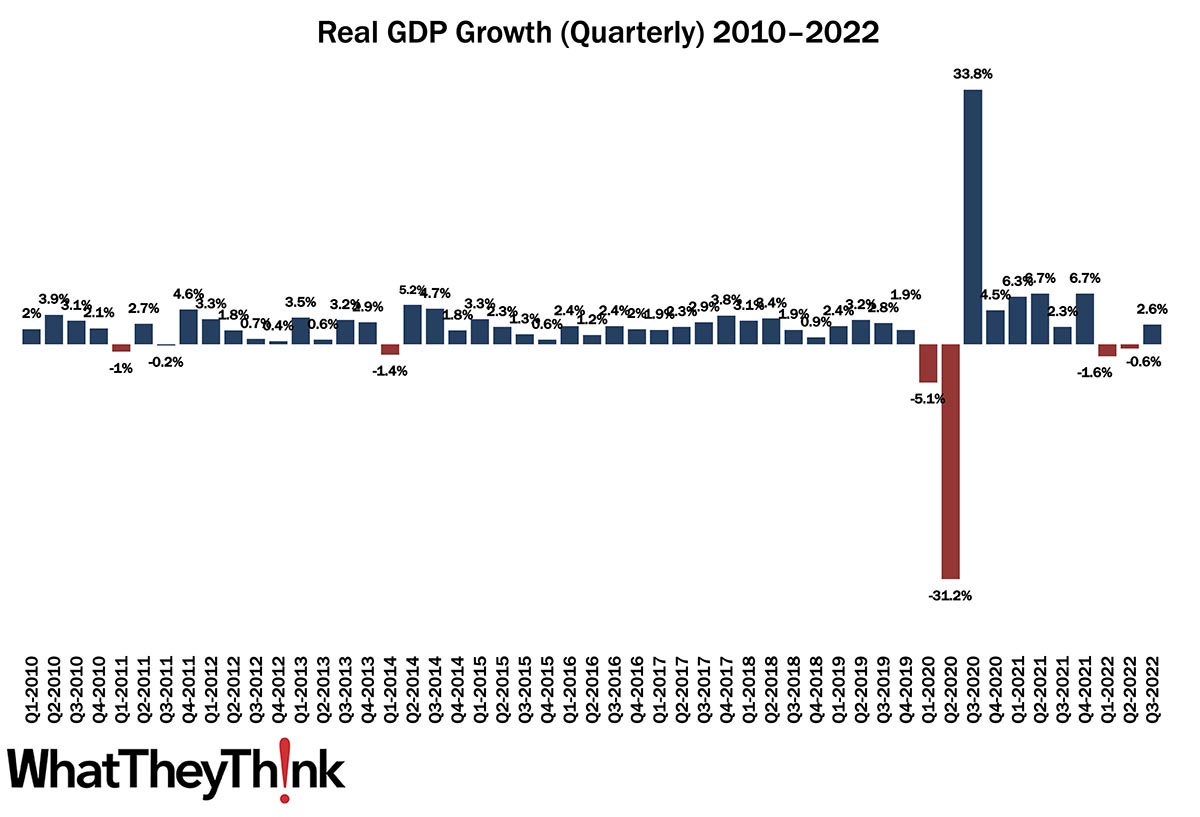
Source: Bureau of Economic Analysis
The GDP report came in above economists expectations. So…GDP growth has been good, employment has been excellent, so really inflation is the only thing anyone has to complain about, and one wonders to what extent prices are high because of inflation—or are high prices causing inflation. That is, given that the usual cause of inflation (cost of employment) has been relatively flat, and profits have been record-breakingly high, are companies raising prices simply because they can? Paul Donovan, chief economist at UBS Global Wealth Management, this week wrote an editorial for Financial Times identifying the real cause of our current inflation problem:
This is the current inflation story. Companies have passed higher costs on to customers. But they have also taken advantage of circumstances to expand profit margins. The broadening of inflation beyond commodity prices is more profit margin expansion than wage cost pressures.
How is this happening? Two forces have combined. Despite negative real wages, consumers have carried on consuming. Strong post-pandemic household balance sheets have allowed lower savings and increased borrowing to offset the sorry state of real wages. The resulting resilience in demand has given companies the confidence to raise prices faster than costs.
In addition, the power of storytelling has conditioned consumers to accept price rises.

