Industry Data
Inflation Multipliers Updated
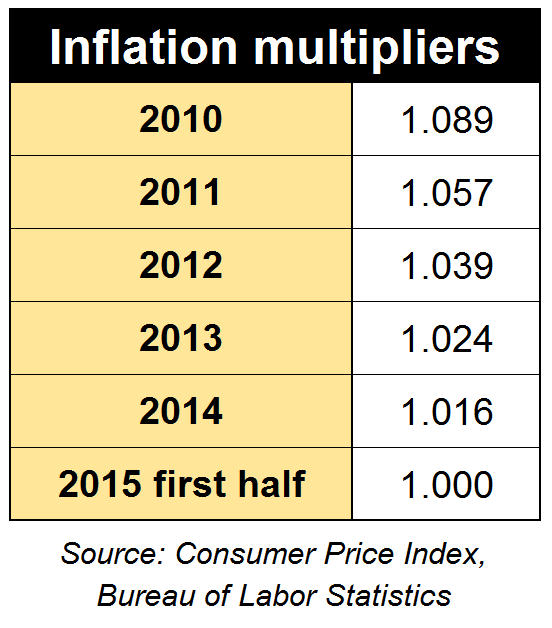
Inflation is supposedly tame, but if you're making comparisons of current year financial data to prior years, you still need to adjust for the years when inflation was not. The chart was created from Consumer Price Index data for each of the years specified. When looking at your company history, multiply your data for each year by the multiplier specified. This will give you an approximation for the effects of inflation on your business, and make your historical analysis, especially in the process of budgeting, to be more realistic. Adjusting your data, even in periods of claimed low inflation, creates a sense of more urgent action. Inflation means that to stay at the same level you actually need more dollars. Staying the same is actually a cut.
Inflation is supposedly tame, but if you're making comparisons of current year financial data to prior years, you still need to adjust for the years when inflation was not. The chart was created from Consumer Price Index data for each of the years specified. When looking at your company history, multiply your data for each year by the multiplier specified. This will give you an approximation for the effects of inflation on your business, and make your historical analysis, especially in the process of budgeting, to be more realistic. Adjusting your data, even in periods of claimed low inflation, creates a sense of more urgent action. Inflation means that to stay at the same level you actually need more dollars. Staying the same is actually a cut.


