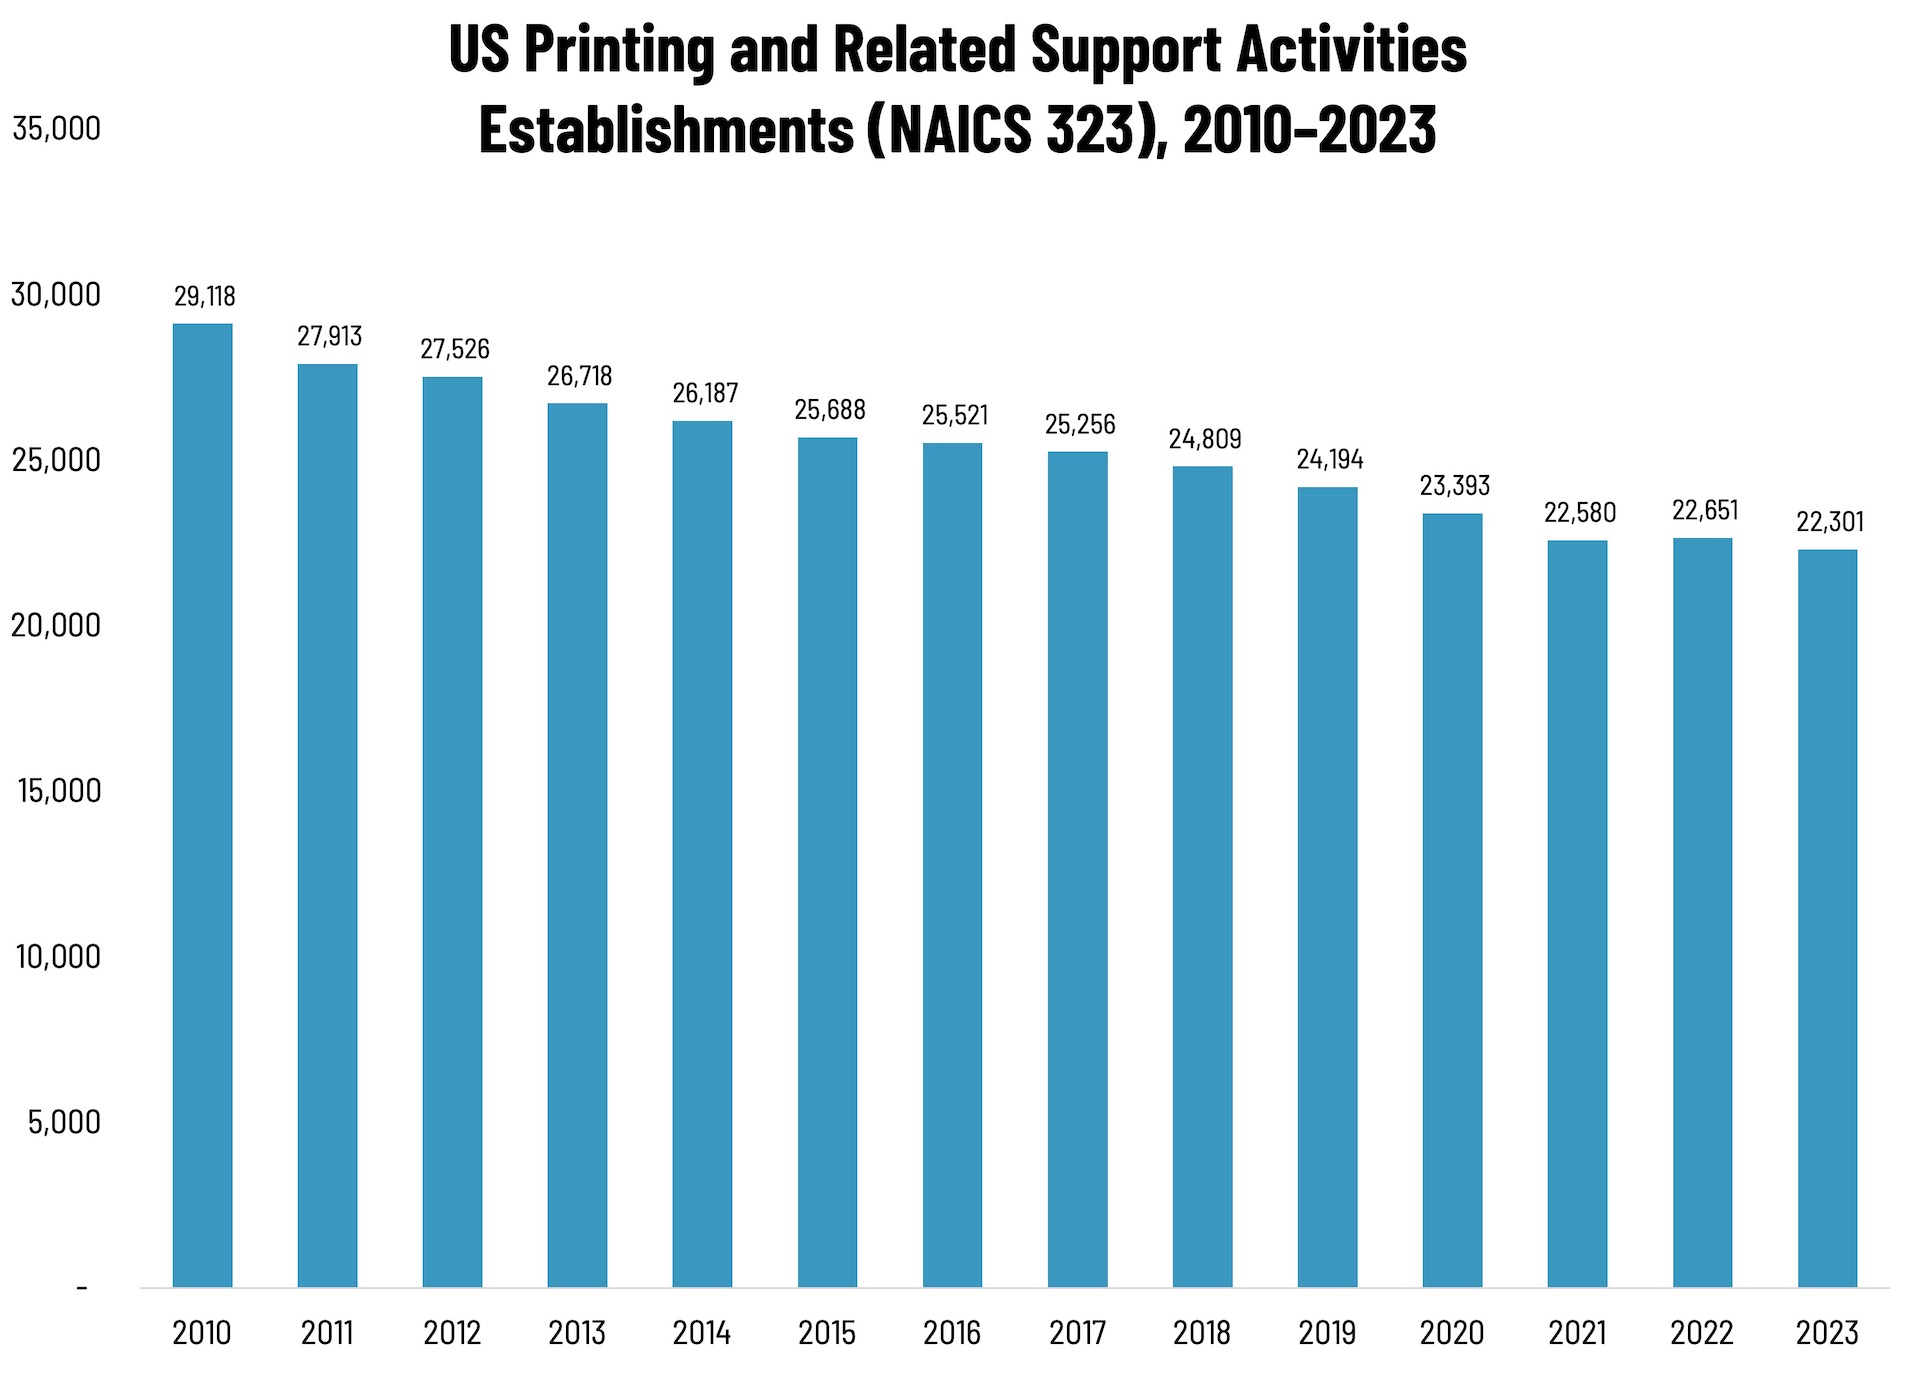
As 2023 began, there were 22,301 establishments in NAICS 323 (Printing and Related Support Activities), which represents a decline of 23% since 2010. From 2010 to 2011, establishments declined by 4%, thanks to the Great Recession, and from 2014 to 2015, the decline was only 2%; and from 2016 to 2017, the decline was 1%. Consolidation picked up toward the end of the decade, with establishments declining 6% from 2018 to 2020. And then the pandemic hit, although the impact was not as bad as we had been expecting. As we remarked in our Printing Outlook 2023 report, based on our Fall 2022 survey, 2022 was the “back in the black” year for the industry, with print buyers racing to replenish the printed materials they had cut back on during the pandemic year(s). However, the slight decline in 2023 represents the challenges the industry has faced since the post-pandemic peak year, which have only gotten worse.
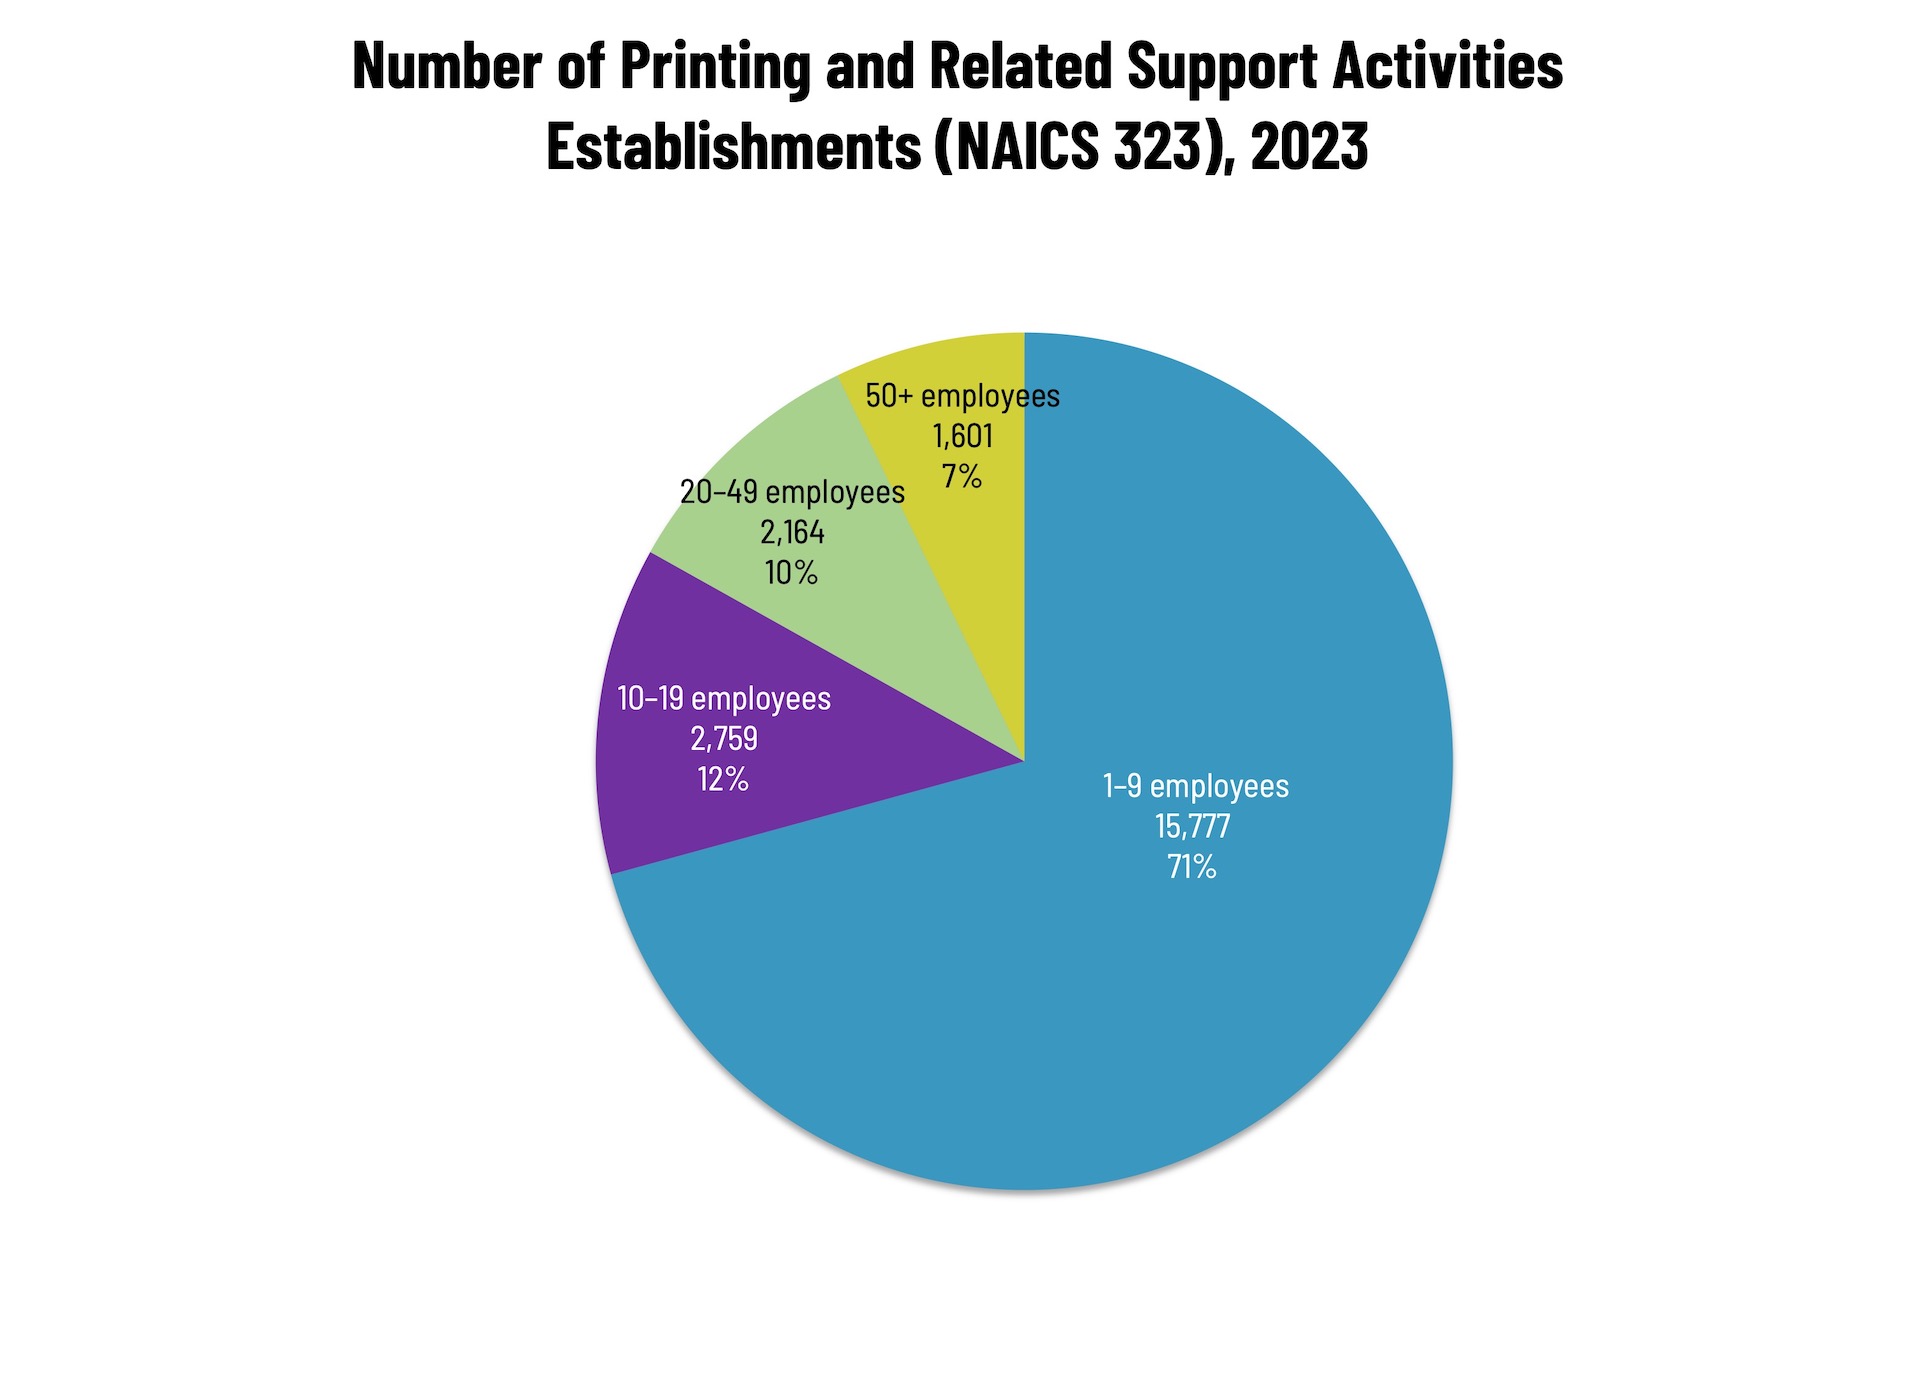
Small shops (1 to 9 employees) still comprise the bulk of the industry, accounting for 71% of all establishments. The largest shops account for only 7% of industry establishments with mid-size shops accounting for 22% of establishments. These percentages have not varied substantially since at least as far back as 2010.
These counts are based on data from the Census Bureau’s County Business Patterns. In the months ahead, we will be updating these data series with the latest CBP figures. County Business Patterns includes other data, such as number of employees, payroll, etc. These counts are broken down by commercial printing business classification (based on NAICS, the North American Industrial Classification System):
- 32311 (Printing)
- 323111 (Commercial Printing, except Screen and Books)
- 323113 (Commercial Screen Printing)
- 323117 (Books Printing)
- 32312 (Support Activities for Printing—aka prepress and postpress services)
These data, and the overarching year-to-year trends, like other demographic data, can be used not only for business planning and forecasting, but also sales and marketing resource allocation.
This Macro Moment…
According to the Bureau of Labor Statistics:
The Consumer Price Index for All Urban Consumers (CPI-U) increased 0.3 percent on a seasonally adjusted basis in February, after rising 0.2 percent in January, the U.S. Bureau of Labor Statistics reported today. Over the last 12 months, the all items index increased 2.4 percent before seasonal adjustment.
That is unchanged from January and is about what economists expected.
The index for shelter rose 0.2 percent in February and was the largest factor in the all items monthly increase. The food index increased 0.4 percent over the month as did the food at home index, while the food away from home index rose 0.3 percent. The index for energy also increased in February, rising 0.6 percent.
It is still four percentage points above what policymakers (aka the Fed) would prefer, but it’s still down from what it was after the “tariffopalooza” kicked off last year. Also note that this data was collected before the Iran War started to affect the price of energy.
The index for all items less food and energy rose 0.2 percent in February. Indexes that increased over the month include medical care, apparel, household furnishings and operations, airline fares, and education. Conversely, the indexes for communication, used cars and trucks, motor vehicle insurance, and personal care were among the major indexes that decreased in February.
If you got gas in the past week, you undoubtedly noticed that it is appreciably more expensive than it was just a few weeks ago. And it’s unclear what other impacts the conflict in the Mideast will have, at least vis-à-vis inflation (wars inevitably have much more horrible effects than higher prices). Says CNBC:
For example, rising jet fuel costs could filter into higher airfares ahead of the busy spring and summer travel seasons; more expensive diesel could feed into elevated food prices due to increased costs to transport food items to the grocery store, economists said.
Great.


