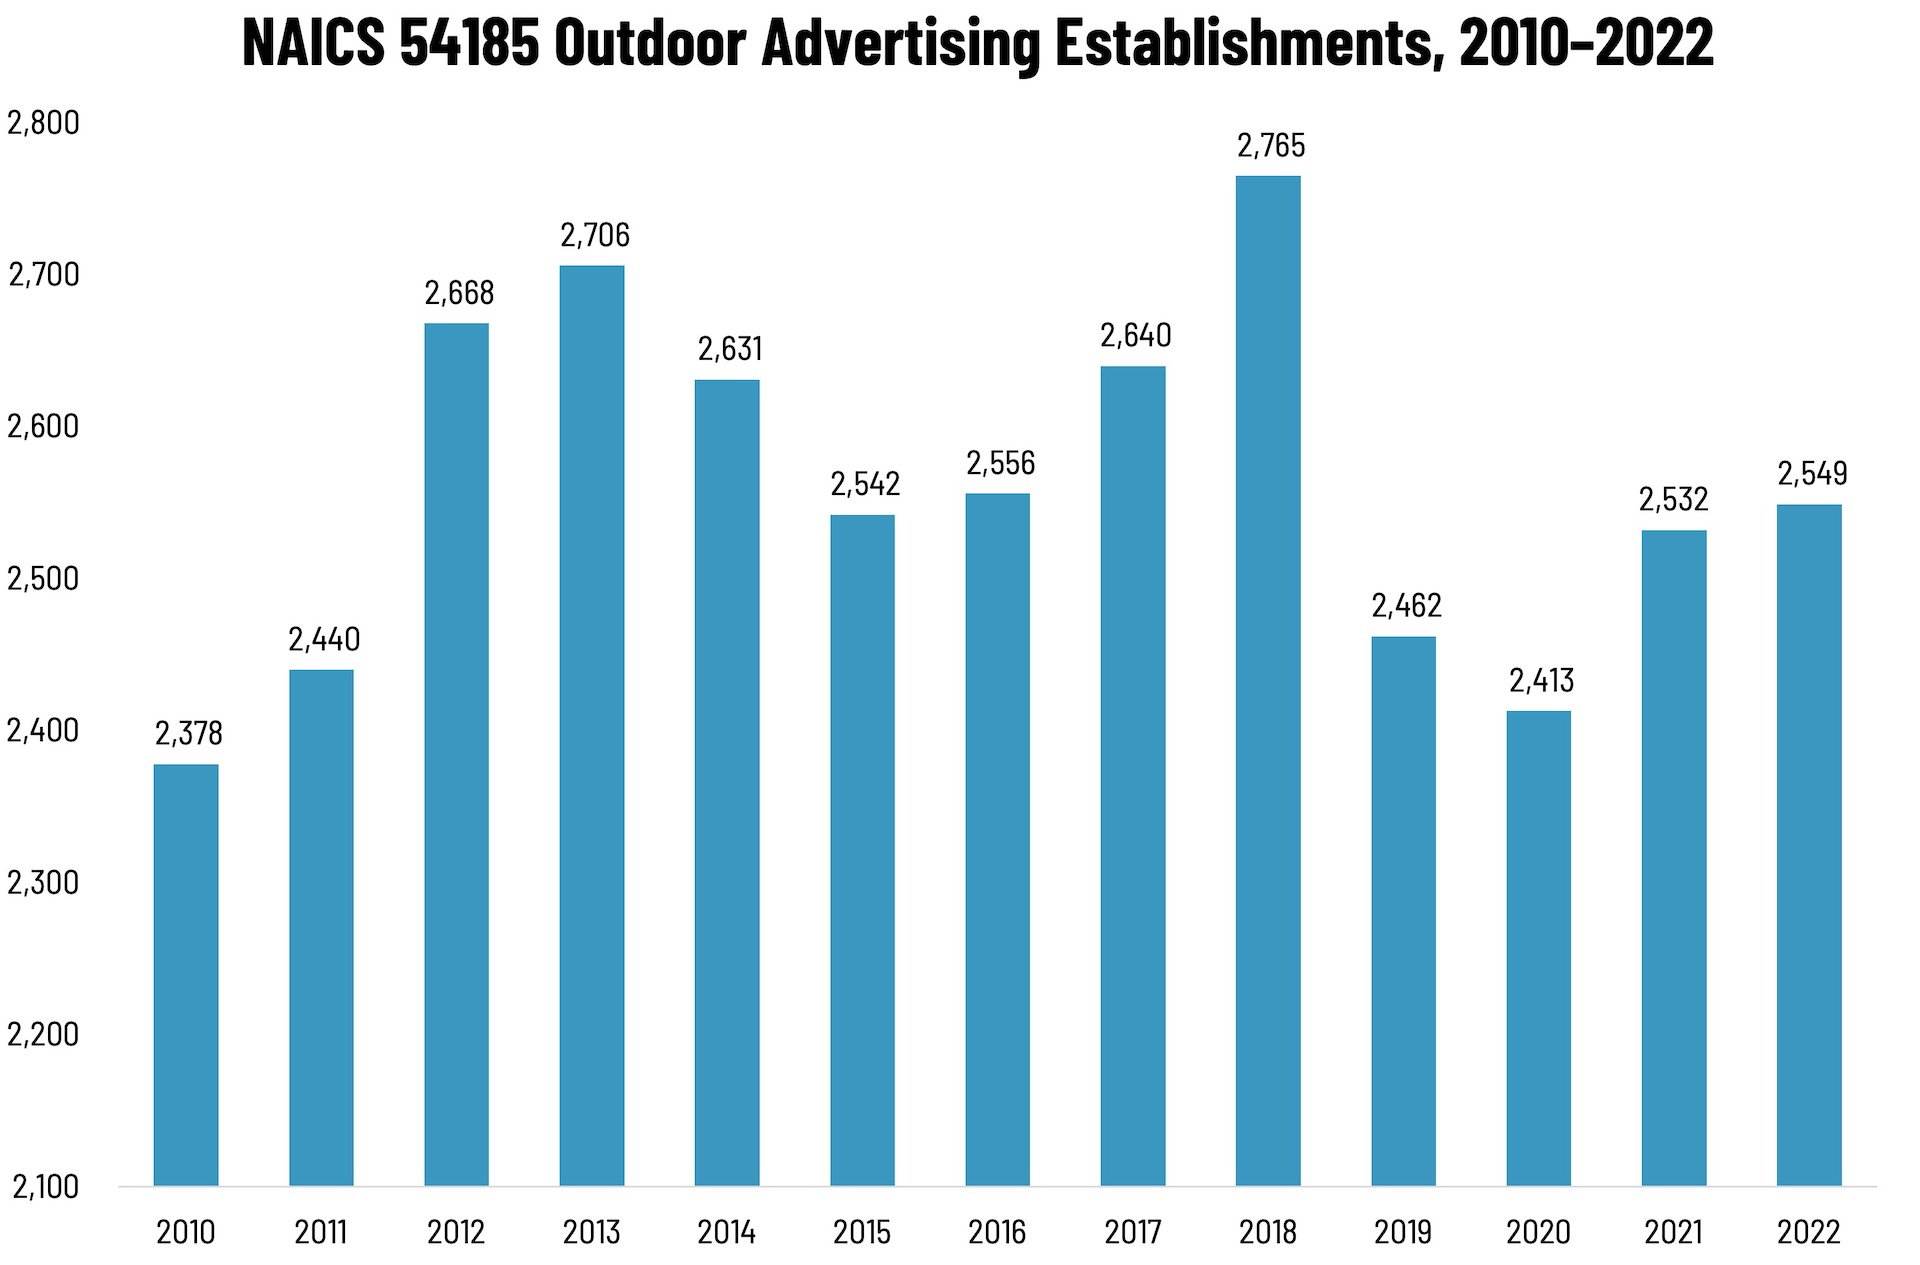
According to County Business Patterns, in 2010, there were 2,378 establishments in NAICS 54185 (Outdoor Advertising). This NAICS grew post-Great Recession, with a slight decline mid-decade before climbing back up to 2,765 establishments in 2018. 2019 saw a massive drop in establishments, but as of 2022 had climbed back to 2,549.
The Bureau of the Census definition for this business classification:
This industry comprises establishments primarily engaged in creating and designing public display advertising campaign materials, such as printed, painted, or electronic displays; and/or placing such displays on indoor or outdoor billboards and panels, or on or within transit vehicles or facilities, shopping malls, retail (in-store) displays, and other display structures or sites.
Prior to 2012, this category had been called “Display Advertising,” and 2012 onward reflects the period when wide-format printing started to become a force to be reckoned with. If you look at some of the specific products that are produced by establishments in this NAICS:
- Advertising services, indoor or outdoor display
- Advertising, aerial
- Billboard display advertising services
- Bus card advertising services
- Bus display advertising services
- Indoor display advertising services
- Out-of-home media (i.e., display) advertising services
- Outdoor display advertising services
- Store display advertising services
- Subway card display advertising services
- Taxicab card advertising services
- Transit advertising services
All of these items were growth areas in the 2010s, as the advent of new wide-format printing systems lowered the barriers to entry to producing these kinds of materials. The Census never had a specific NAICS for “wide-format printing establishments,” but this is among the closest they ever came. As for the declines toward the end of the decade, chalk that up to consolidation as well as the adoption of wide-format printing by general commercial printing (NAICS 323) and other businesses in other business categories that may also produce more diverse materials, with “outdoor advertising” largely coming to refer to billboards and the like rather than the disparity of wide-format applications that were seen earlier.
The way the Census Bureau captures establishment counts means that any business that existed at all in 2022 was included—which means that the drop in establishments was not due to the COVID pandemic; indeed, the climb in 2021 represents the net change in establishments due to COVID. Signage and display graphics were growth areas during the pandemic.
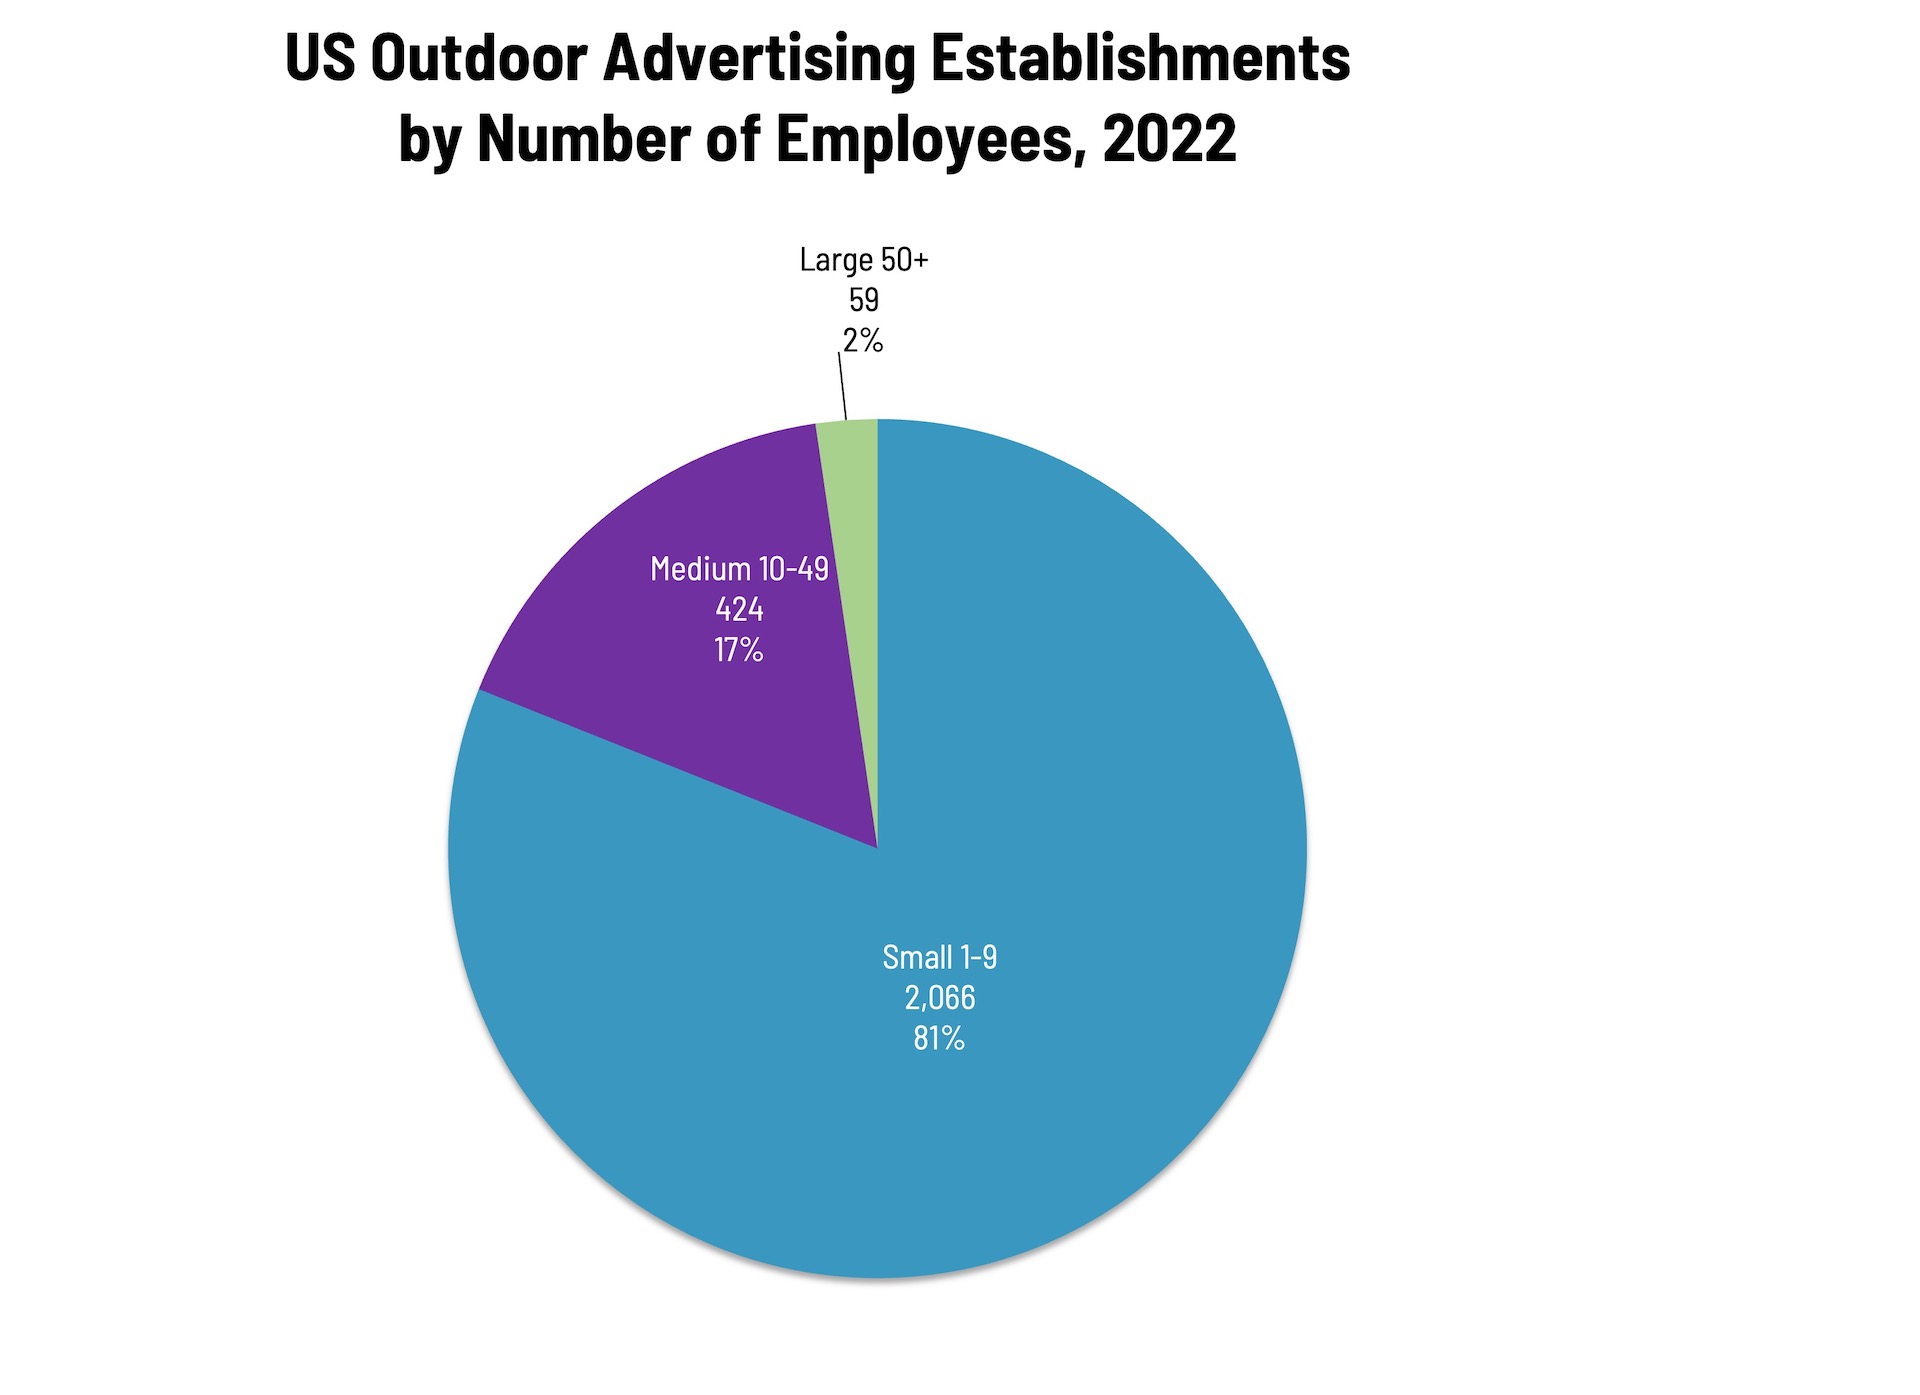
Establishments in this category are concentrated at the small end, with 81% having 1–9 employees, 17% having 10–49 employees, and only 2% having more than 50 employees.
Next up in our data slice’n’dice series, we start our series with data from the newest edition of County Business Patterns, whuch includes 2023 data. We are going to circle back to our old friends in NAICS 323 and see what that year hath wrought:
- 323 Printing and Related Support Activities
- 32311 Printing
- 323111 Commercial Printing (except Screen and Books)
- 323113 Commercial Screen Printing
- 323117 Books Printing
- 32312 Support Activities for Printing
These data, and the overarching year-to-year trends, like other demographic data, can be used not only for business planning and forecasting, but also sales and marketing resource allocation.
This Macro Moment
We haven’t looked at retail sales in a while. The most recent report from January covers November retail sales data. Said the Census Bureau on January 14:
Advance estimates of U.S. retail and food services sales for November 2025, adjusted for seasonal variation and holiday and trading-day differences, but not for price changes, were $735.9 billion, up 0.6 percent (±0.4 percent) from the previous month, and up 3.3 percent (±0.5 percent) from November 2024. Total sales for the September 2025 through November 2025 period were up 3.6 percent (±0.4 percent) from the same period a year ago. The September 2025 to October 2025 percent change was revised from virtually unchanged (±0.5 percent) to down 0.1 percent (±0.2 percent).
Retail trade sales were up 0.6 percent (±0.5 percent) from October 2025, and up 3.1 percent (±0.5 percent) from last year. Nonstore retailers were up 7.2 percent (±1.2 percent) from last year, while food service and drinking places were up 4.9 percent (±1.8 percent) from November 2024.
Monthly Advance Retail Sales, 01/01/2010–11/01/2025
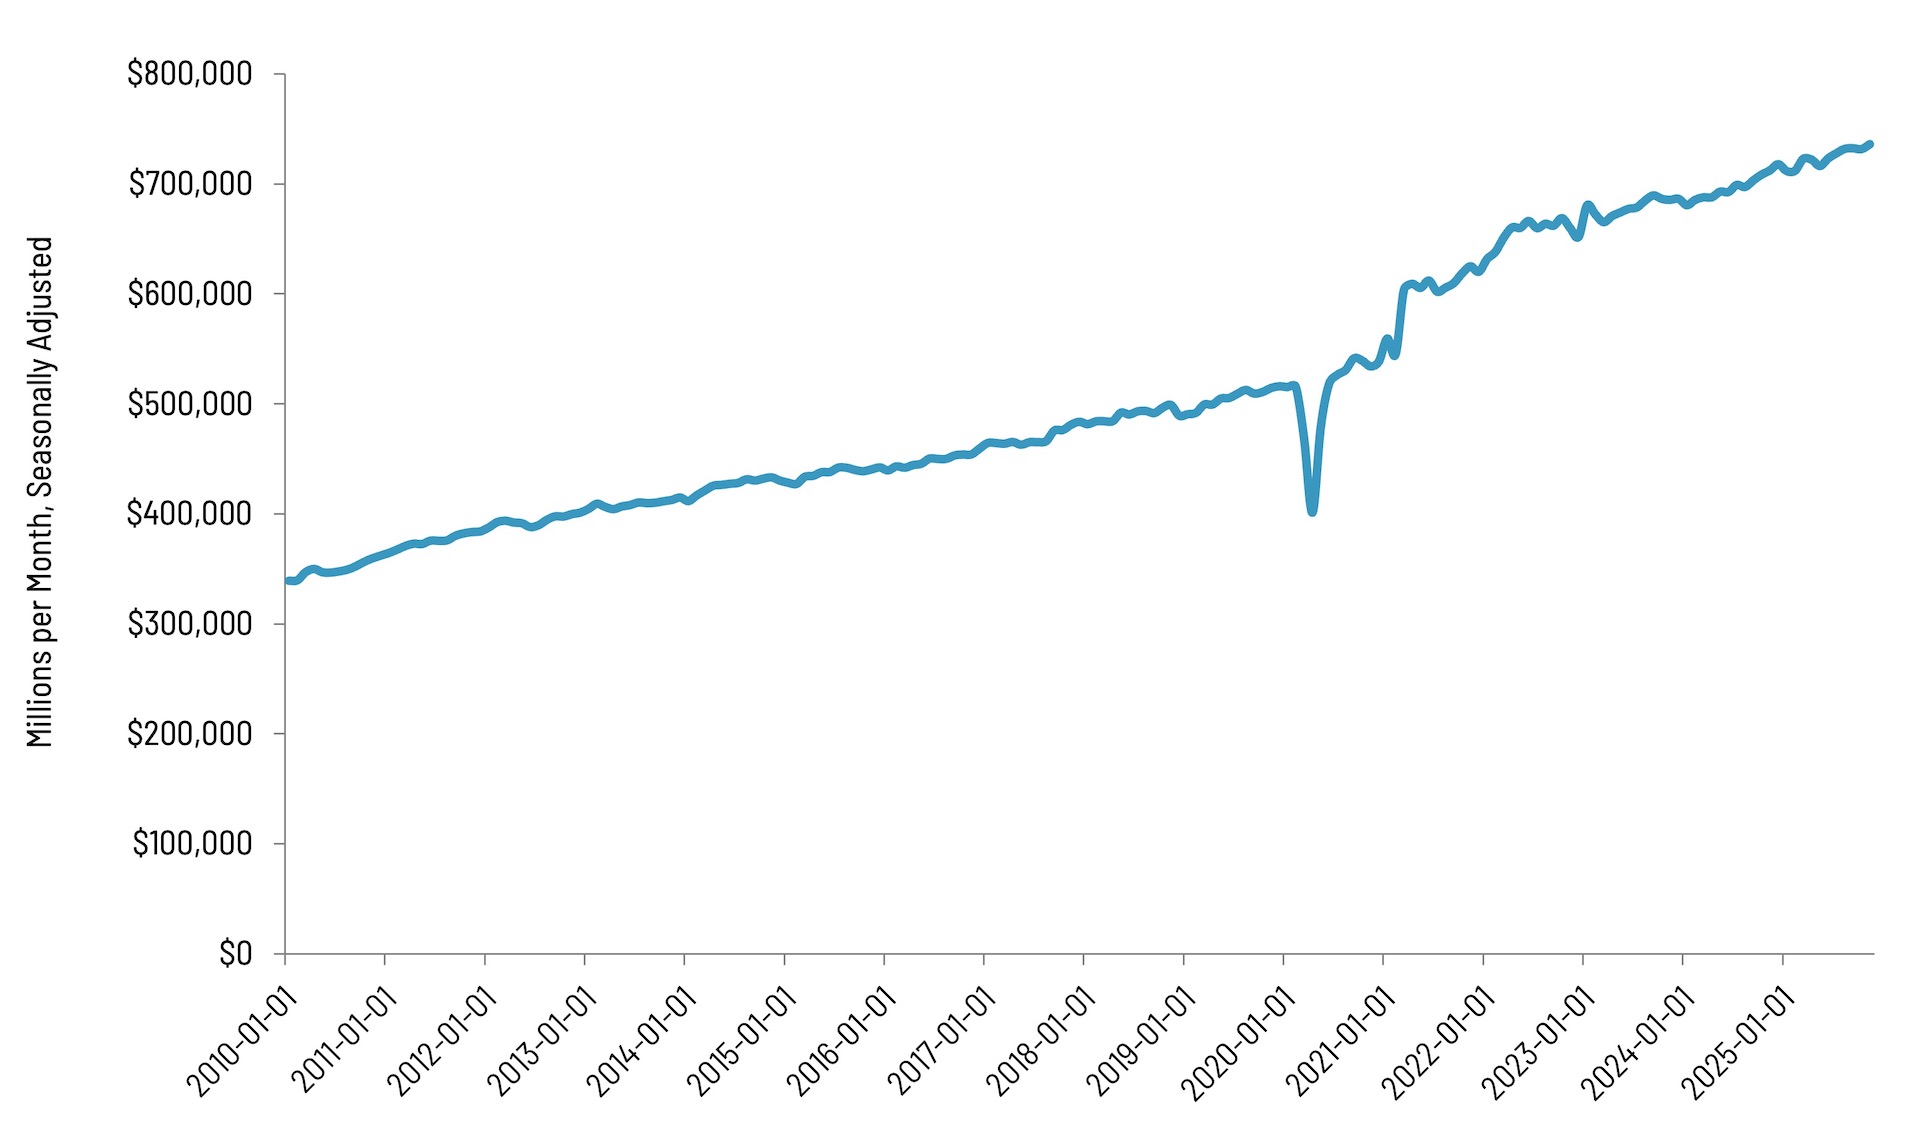
Source: Bureau of the Census
Year-Over-Year Change in Advance Retail Sales, 01/01/2010–11/01/2025
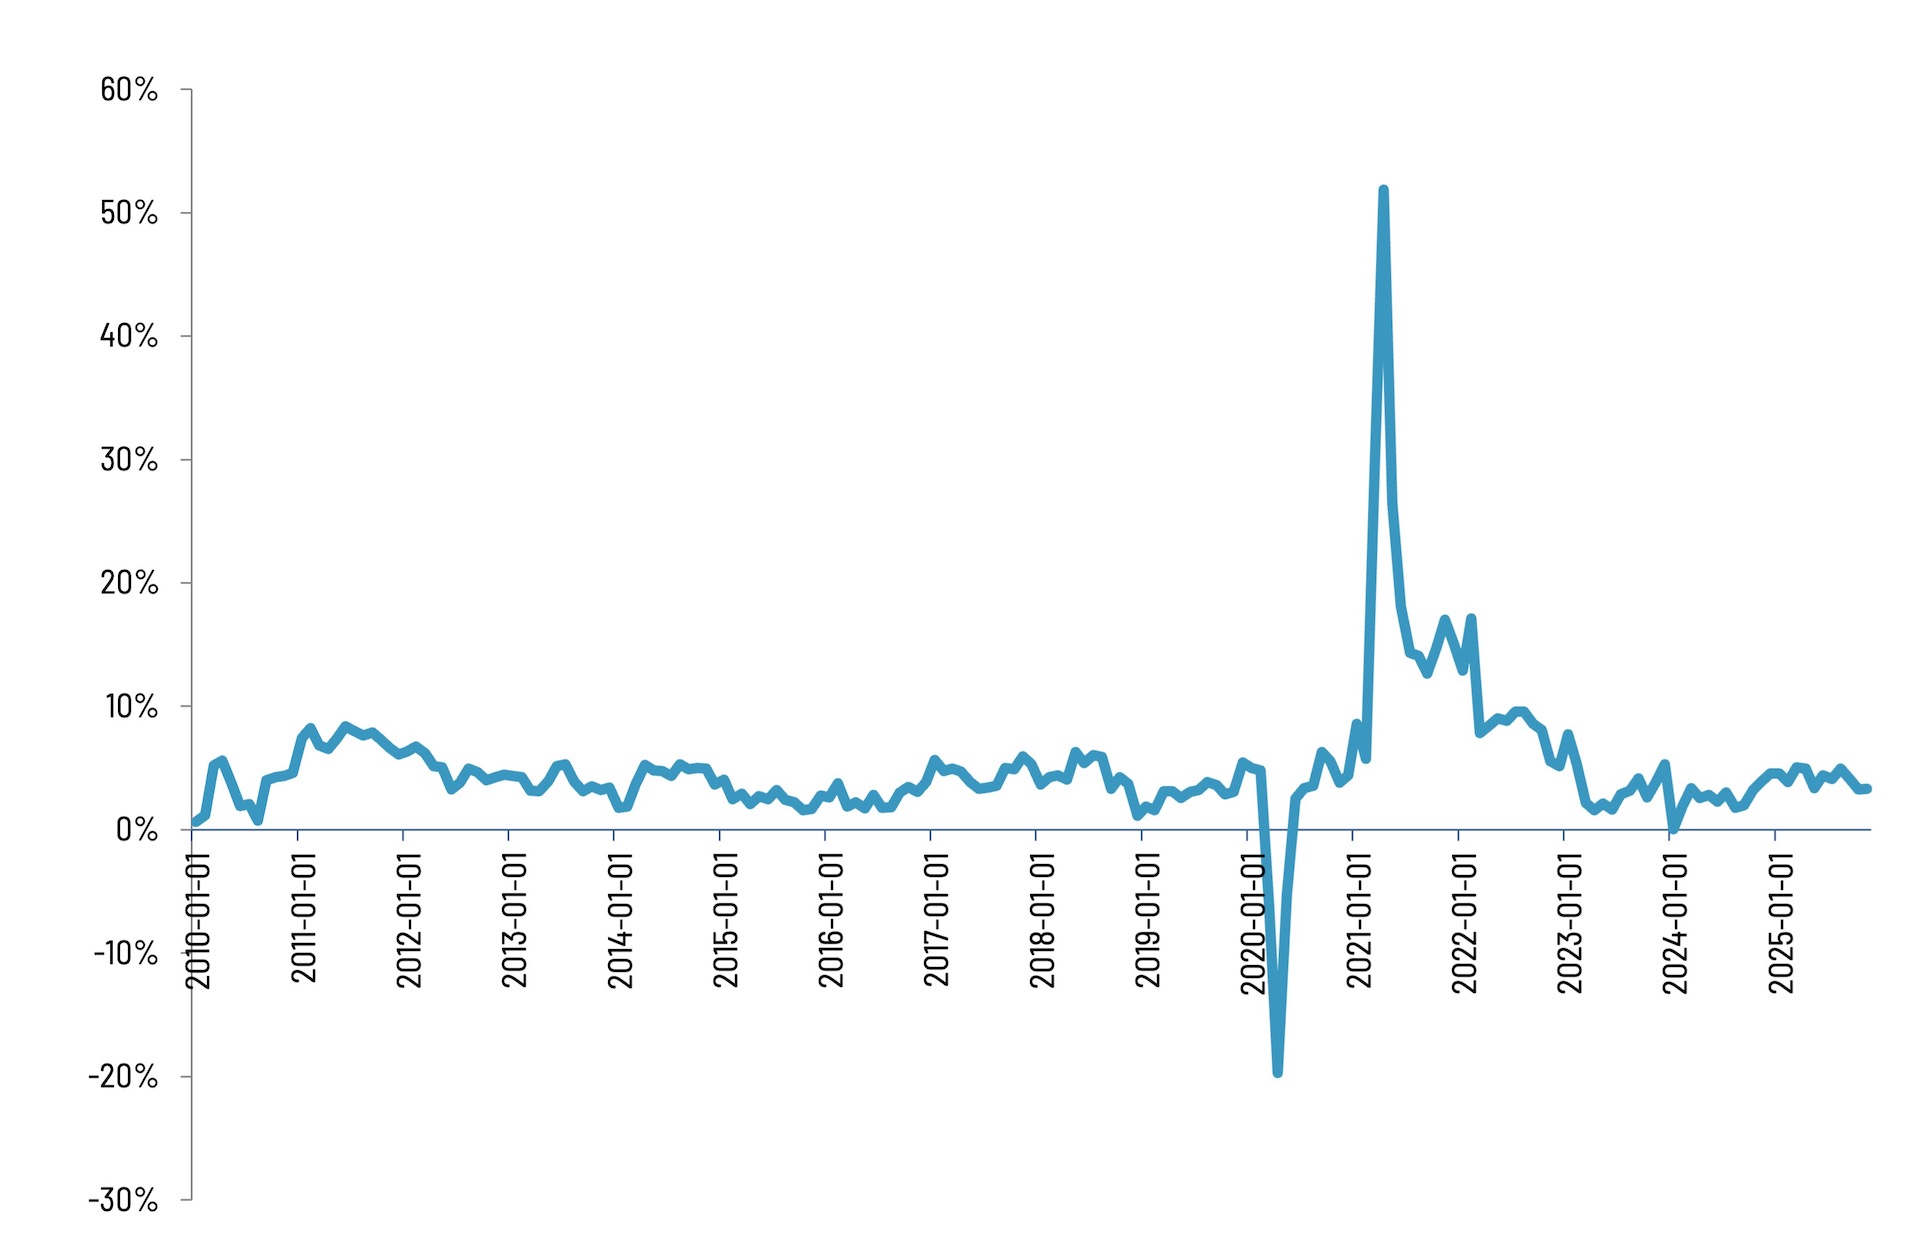
Source: Bureau of the Census
Retail sales for the month were above economists’ expectations.


