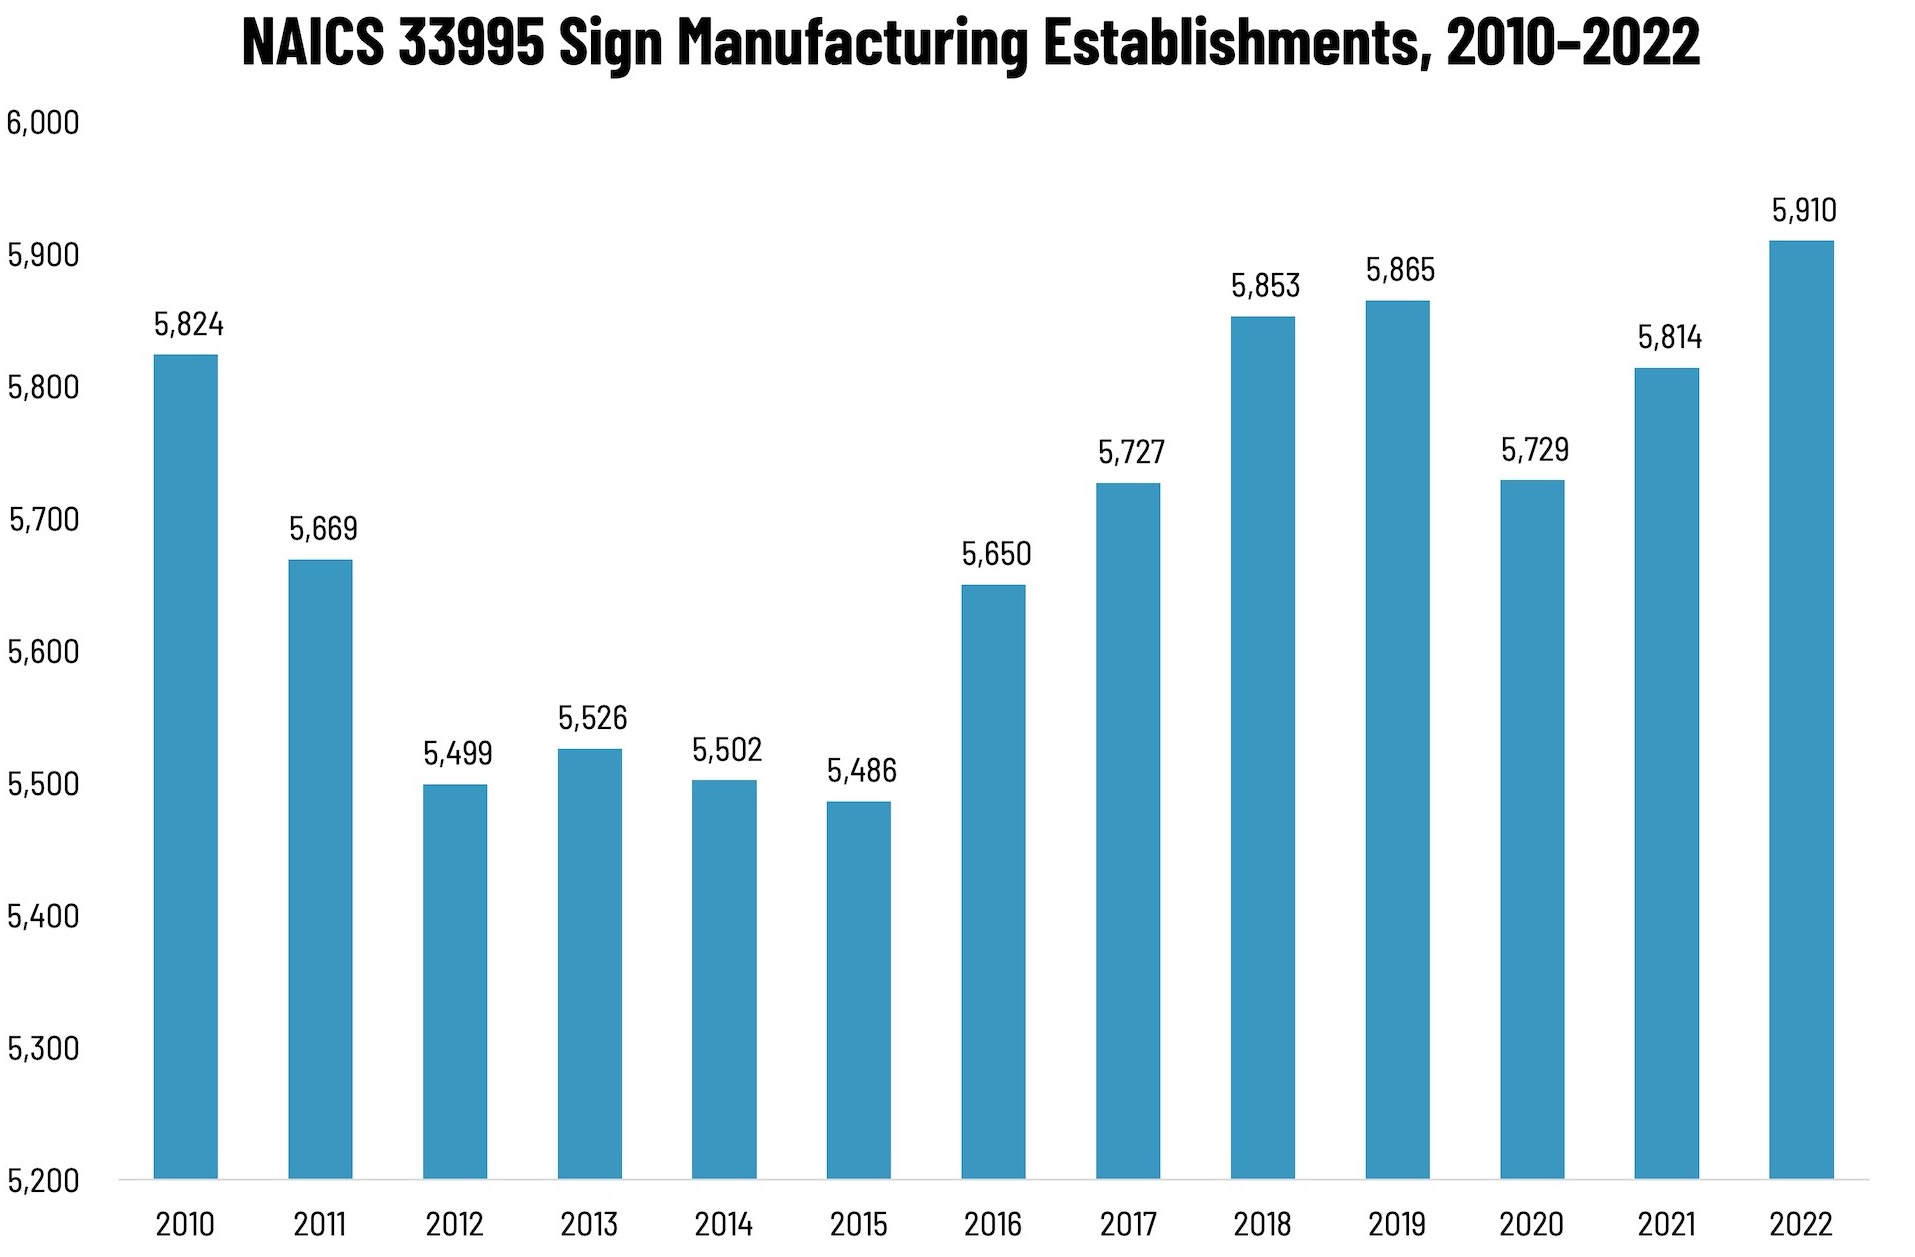
According to County Business Patterns, in 2010, there were 5,824 establishments in NAICS 33995 (Sign Manufacturing). Establishments in this NAICS category declined in the wake of the Great Recession, ultimately climbing back up to 5,865 establishments in 2019, dropping in 2020, and then climbing back up to an all-time high of 5,910 in 2022.
The Bureau of the Census definition for this business classification:
This industry comprises establishments primarily engaged in manufacturing signs and related displays of all materials (except printing paper and paperboard signs, notices, displays).
During and in the immediate aftermath of the Great Recession, there was decreased demand for signage, which didn’t reverse itself until new business began forming as the economy improved, and existing companies underwent a rebrand. By the end of the decade, rebrand cycles were shorter, while at the same time consolidation in verticals such as healthcare and banking drove up the demand for new signage projects. The years preceding the pandemic saw a lot of business expansion, with chains opening new locations. All these trends drove up the demand for signage, which in turn drove up the number of providers of signage.
The way the Census Bureau captures establishment counts means that any sign manufacturing business that existed at all in 2020 was included—which means that the drop in establishments was not due to the COVID pandemic; indeed, the climb in 2021 represents the net change in establishments due to COVID. Signage and display graphics were growth areas during the pandemic.
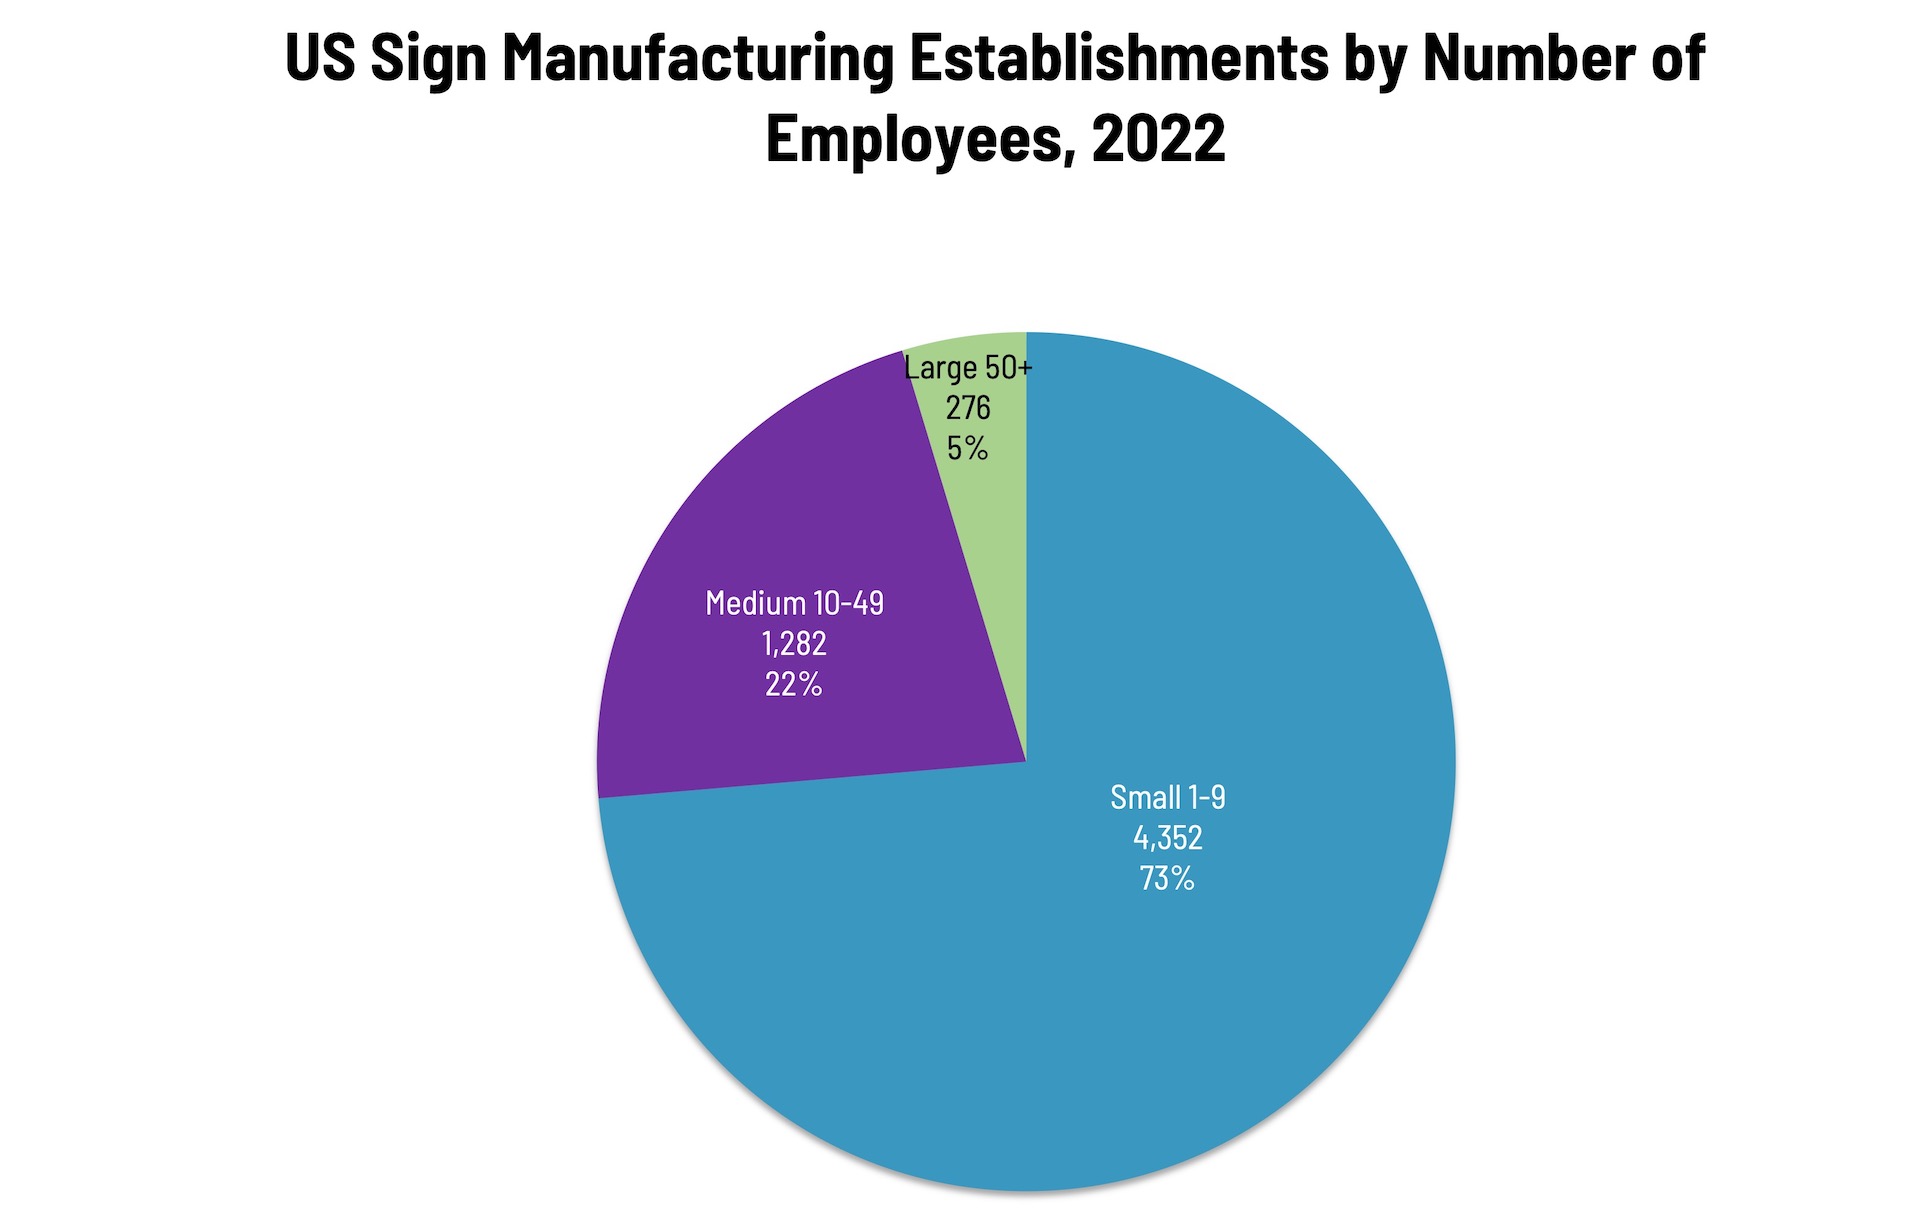
Establishments in this category are concentrated at the small end, with 73% having 1–9 employees, 22% having 10–49 employees, and only 5% having more than 50 employees.
Next up in our data slice’n’dice series:
- NAICS 541850 Display/Outdoor Advertising
These data, and the overarching year-to-year trends, like other demographic data, can be used not only for business planning and forecasting, but also sales and marketing resource allocation.
This Macro Moment
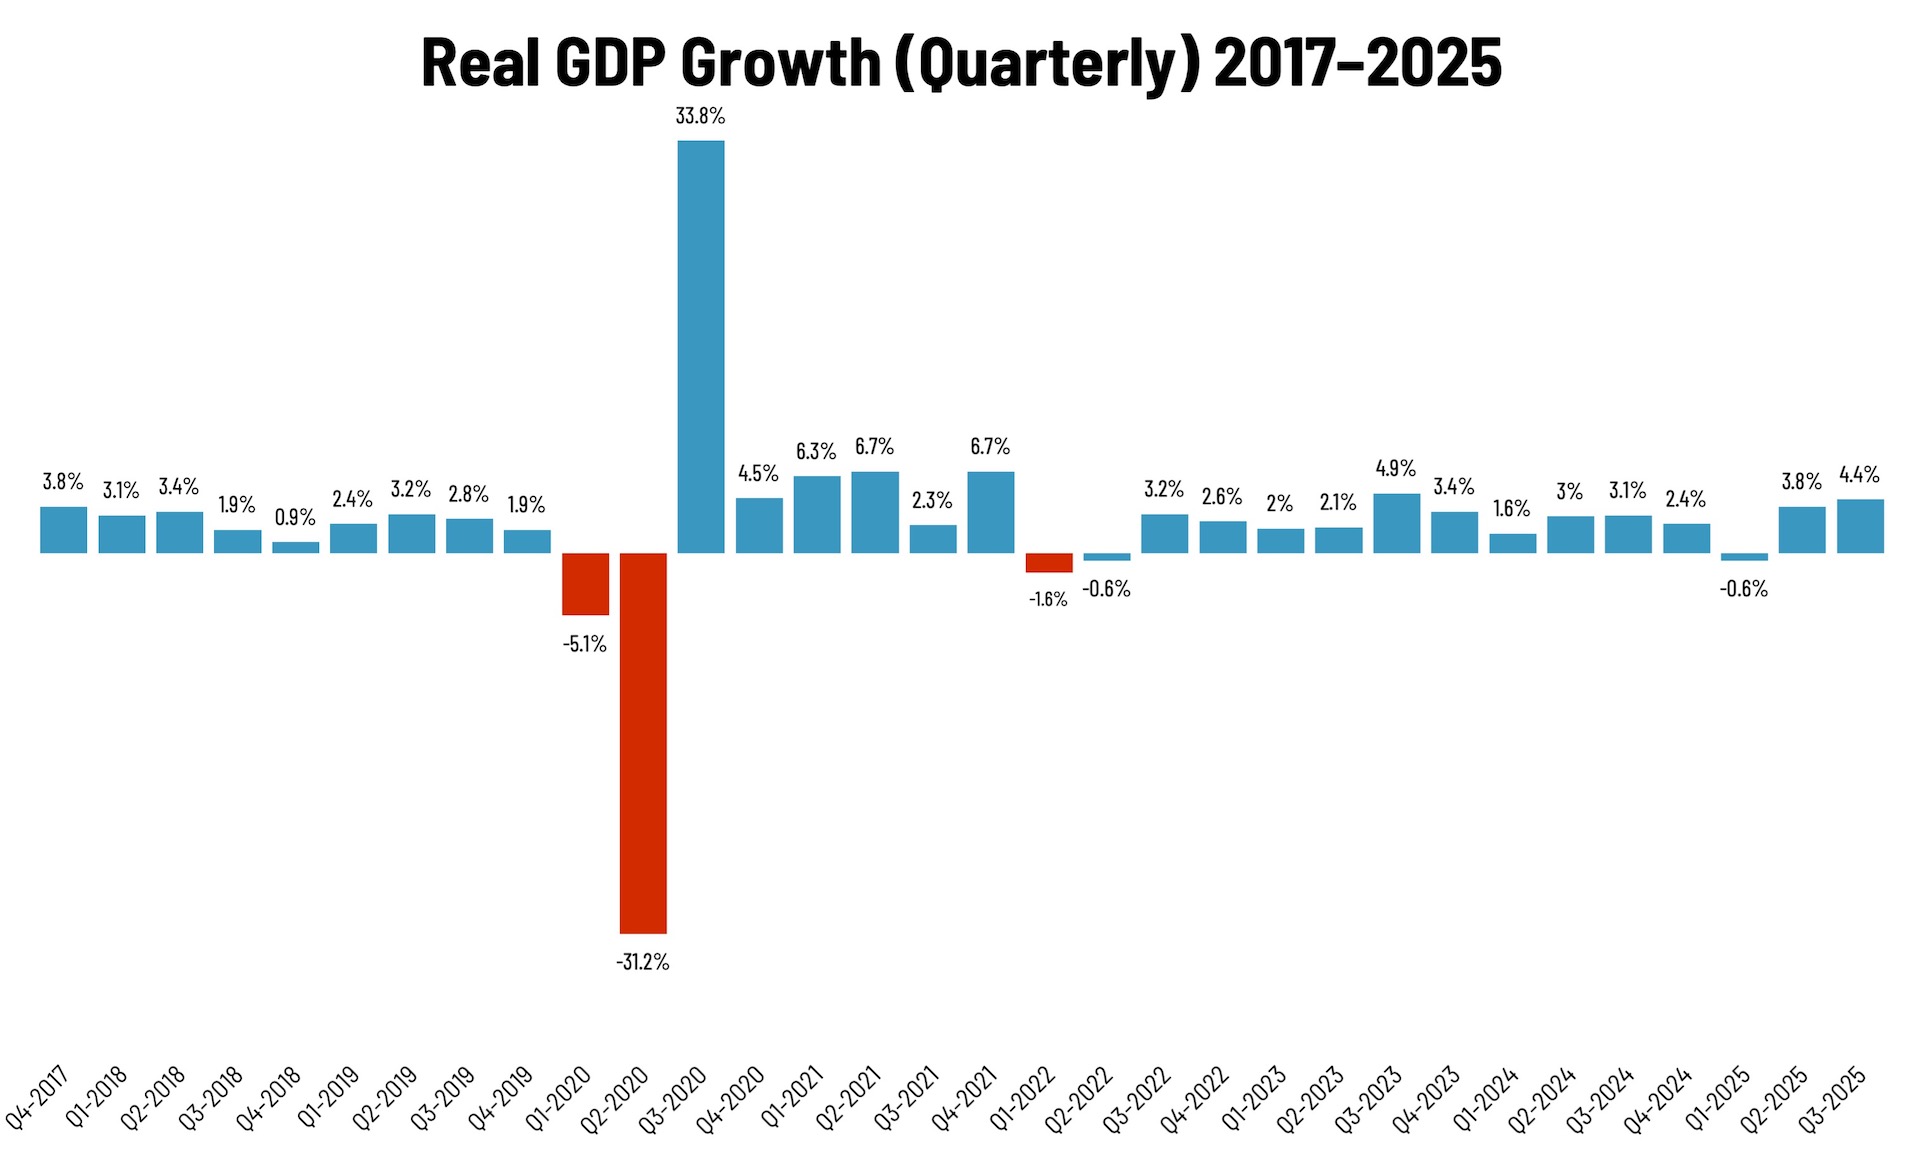
Yesterday, in its updated estimate of Q3 GDP, the Bureau of Economic Analysis reported:
Real gross domestic product (GDP) increased at an annual rate of 4.4 percent in the third quarter of 2025 (July, August, and September), according to the updated estimate released by the U.S. Bureau of Economic Analysis. In the second quarter, real GDP increased 3.8 percent.
The increase was attributed to increases in consumer spending, exports, government spending, and investment. Imports, on the other hand, which subtract from GDP, decreased.