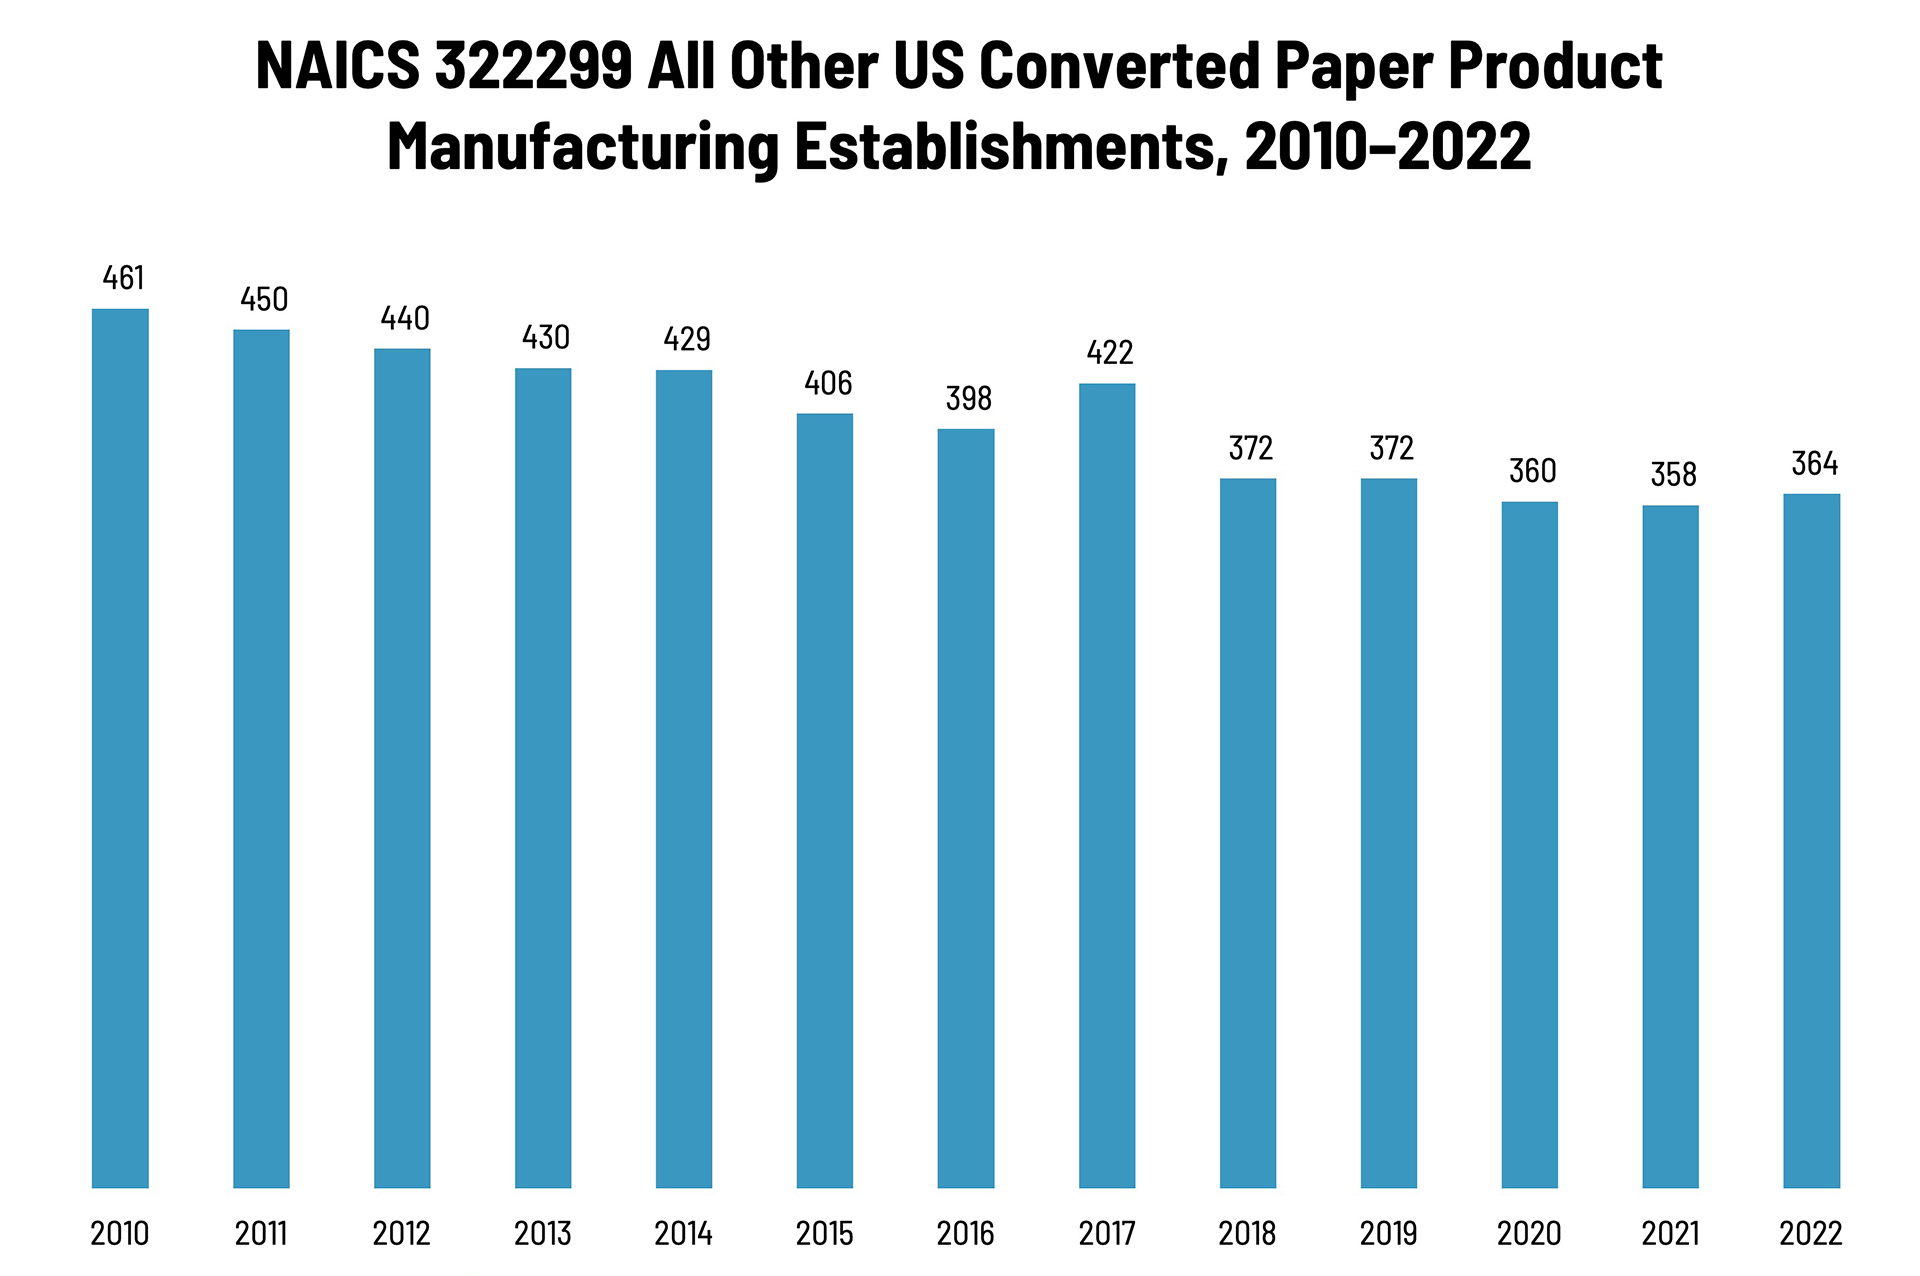
According to County Business Patterns, in 2021, there were 364 establishments in NAICS 322299 (All Other Converted Paper Product Manufacturing). This NAICS category has declined steadily over the course of the decade, although not as dramatically as some of the other categories we have been looking at. There was a big spike in 2017, and these establishments grew again from 2021 to 2022.
The Bureau of the Census definition for this business classification:
This U.S. industry comprises establishments primarily engaged in converting paper or paperboard into products (except containers, bags, coated and treated paper, stationery products, and sanitary paper products) or converting pulp into pulp products, such as egg cartons, food trays, and other food containers from molded pulp.
Basically, this category comprises the establishments in 32229 (which we looked at previously) with 322291 (Sanitary Paper Products Manufacturing) backed out.
As we said in our commentary on 32229, since this product category largely comprises food trays, egg cartons, and a similar hodgepodge of food packaging-related products, trends in this packaging category will depend upon trends in the types of food they contain. Competition from foam-based food trays and cartons was and continues to be substantial, and while cushioning, cost-effectiveness, and moisture-impermeability work in foam’s favor, biodegradability/sustainability works in the favor of paper-based trays/cartons. At the time, there was also increased demand for food trays/packaging (take-out, restaurant leftovers, school and cafeteria use, etc., e.g.), but had been moving in foam’s direction. (There was of course a spike in home delivery/take-out during the lockdowns of 2020, so it will be interesting to see what this data series looks like next year.) At the same time, the increasing number of municipal bans on foam takeout containers can work to paper’s advantage.
Establishments in this category are pretty evenly distributed, although the past year saw some consolidation, as large and mid-size establishments grew and smaller establishments declined. Small converted product manufacturers (1 to 9 employees) account for 31% of all establishments, large manufacturers (50+ employees) account for 25% of establishments, and mid-size establishments (10–49 employees) account for 44%.
These counts are based on data from the Census Bureau’s County Business Patterns. Every other week, we update these data series with the latest figures. These counts are broken down by printing business classification (based on NAICS, the North American Industrial Classification System).
To clarify what is included in the 2022 CBP, establishment counts represent the number of locations with paid employees at any time during the year. If an establishment existed at any point during the year, it would be included in the CBP count of the number of establishments for 2022 CBP. Thus, this series includes those businesses lost during the COVID pandemic.
These data, and the overarching year-to-year trends, like other demographic data, can be used not only for business planning and forecasting, but also sales and marketing resource allocation.
Next up: signage!
- 33995 Sign manufacturing establishments
- 541850 Outdoor Advertising
This Macro Moment…
According to the Bureau of Labor Statistics (BLS) on December 18:
The Consumer Price Index for All Urban Consumers (CPI-U) increased 0.2 percent on a seasonally adjusted basis over the 2 months from September 2025 to November 2025, the U.S. Bureau of Labor Statistics reported today. Over the last 12 months, the all items index increased 2.7 percent before seasonal adjustment. BLS did not collect survey data for October 2025 due to a lapse in appropriations.
…The all items index rose 2.7 percent for the 12 months ending November, after rising 3.0 percent over the 12 months ending September. The all items less food and energy index rose 2.6 percent over the last 12 months. The energy index increased 4.2 percent for the 12 months ending November. The food index increased 2.6 percent over the last year.
The government shutdown negatively impacted data collection, but economists in particular cited some flaws in the CPI report that suggest that the inflation rate was understated. Said CNBC:
The November data release Thursday was delayed by 8 days because of the U.S. government shutdown, but more importantly, the October data was canceled, leaving it to the BLS to make certain methodological assumptions about the prior month’s inflation levels.
The primary issue? Owners’ equivalent rent (OER).
UBS economist Alan Detmeister said the price changes in October for the OER appear to have been “set to zero.”
Evercore ISI’s Krishna Guha, digging deeper, said it appears the BLS “put in zero inflation in multiple categories” while calculating the OER for the approximately one-third of cities used.
“To the extent that it introduces a downward bias, the Fed would be mindful of the risk of taking the data on housing services inflation at face value,” he wrote in a Thursday note.
The upshot?
“The market seems to be taking the data as a dovish signal, but given the technical quirks we expect the Fed will put less weight on this reading,” she said in a note to clients. “While its positive inflation doesn’t appear to be rising strongly on the back of tariffs, there will likely be a bounce back as the data normalizes after the shutdown-related volatility.”