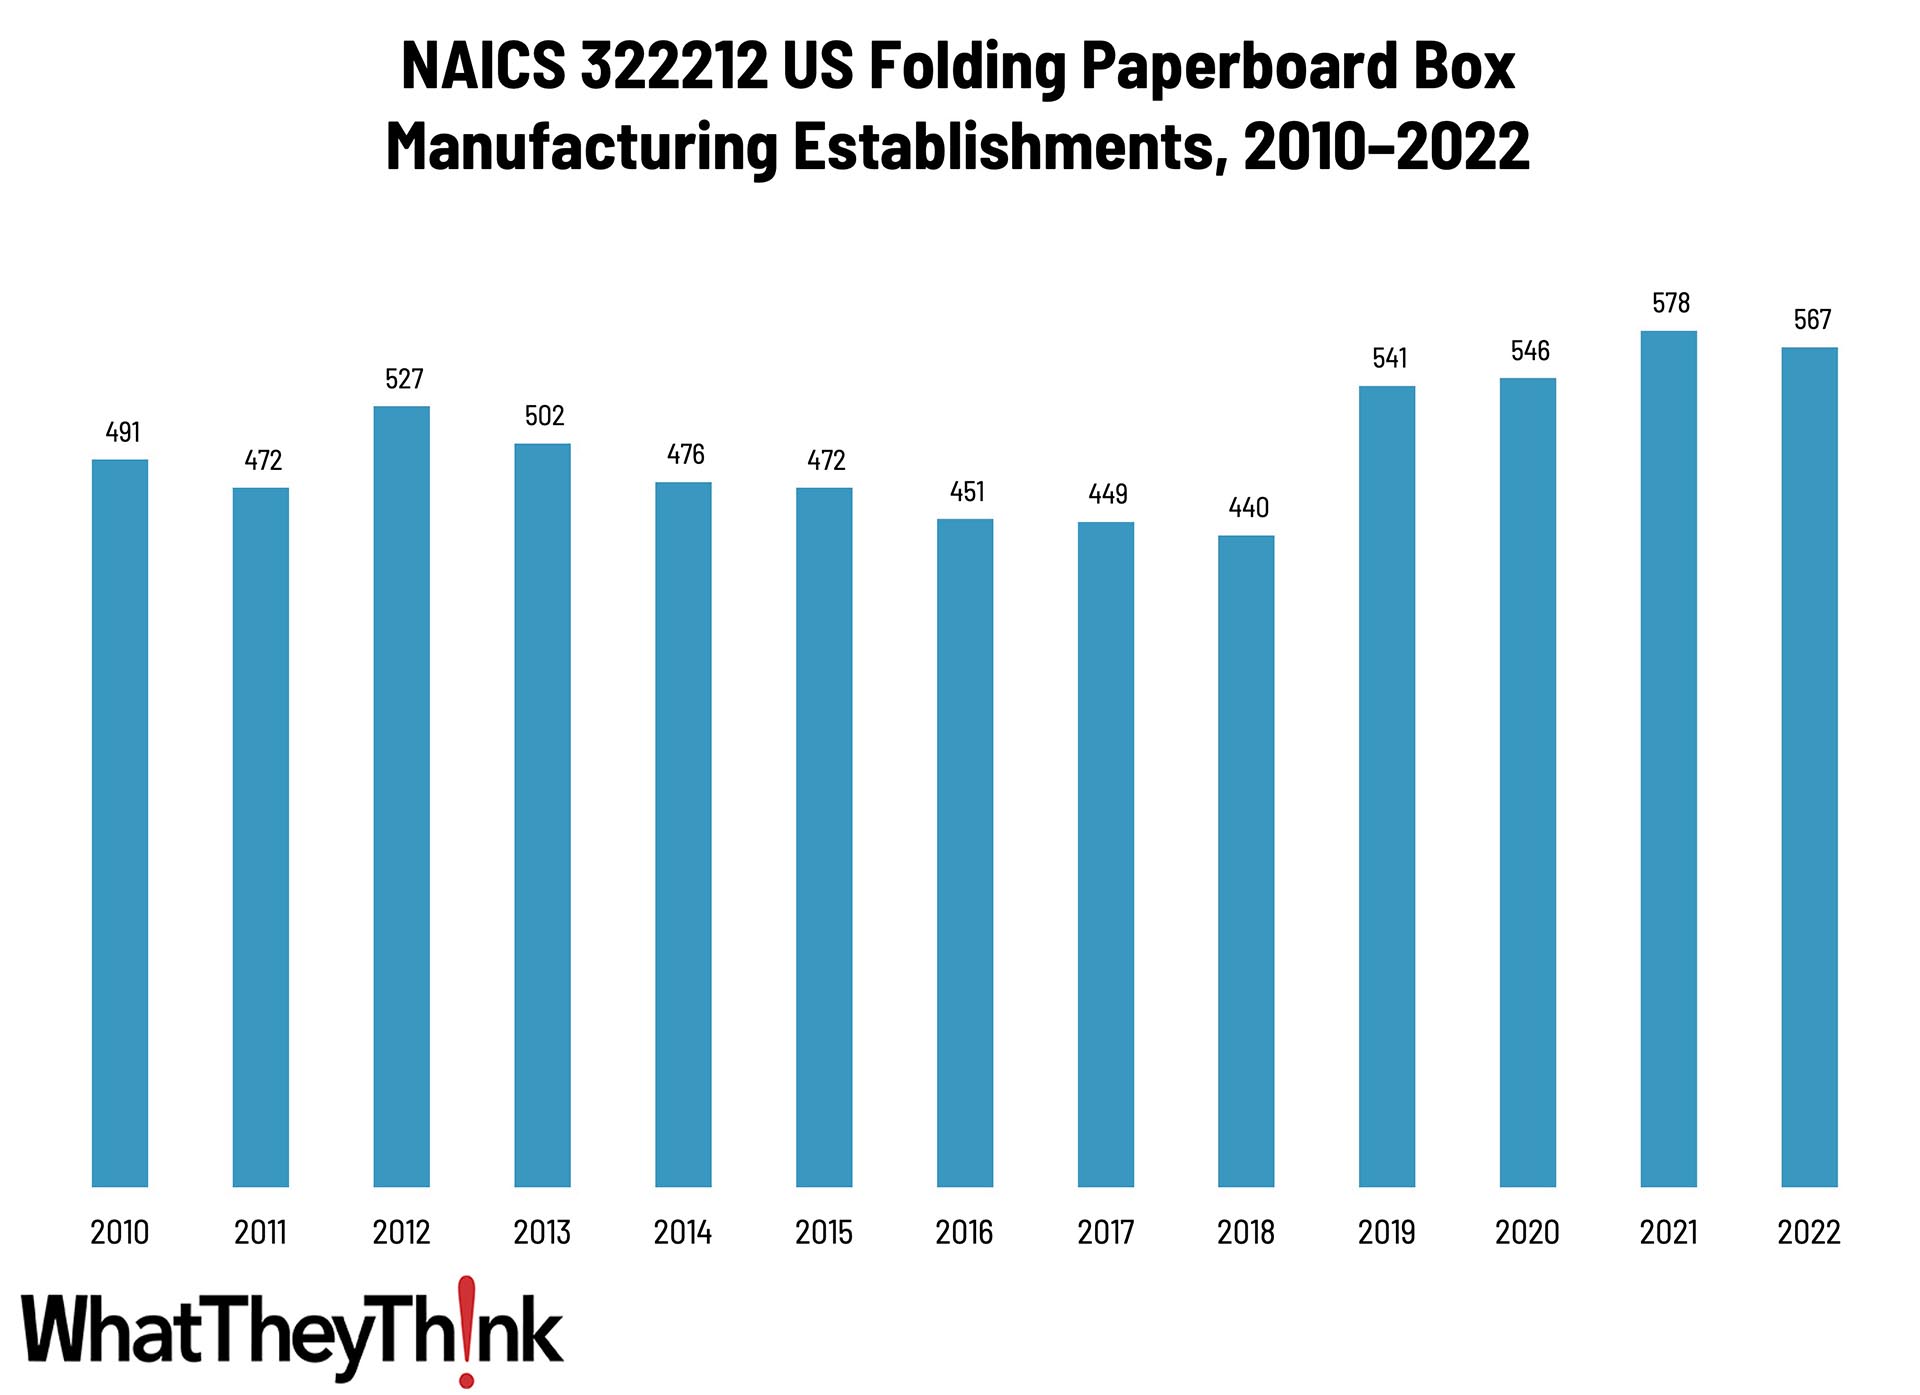
Our Friday data slice’n’dice look at the latest edition of County Business Patterns has been looking at the converting industries. As 2021 began, there were 567 establishments in NAICS 322212 (Folding Paperboard Box Manufacturing). This category saw a net increase of 15% since 2010.
The Bureau of the Census definition for this business classification:
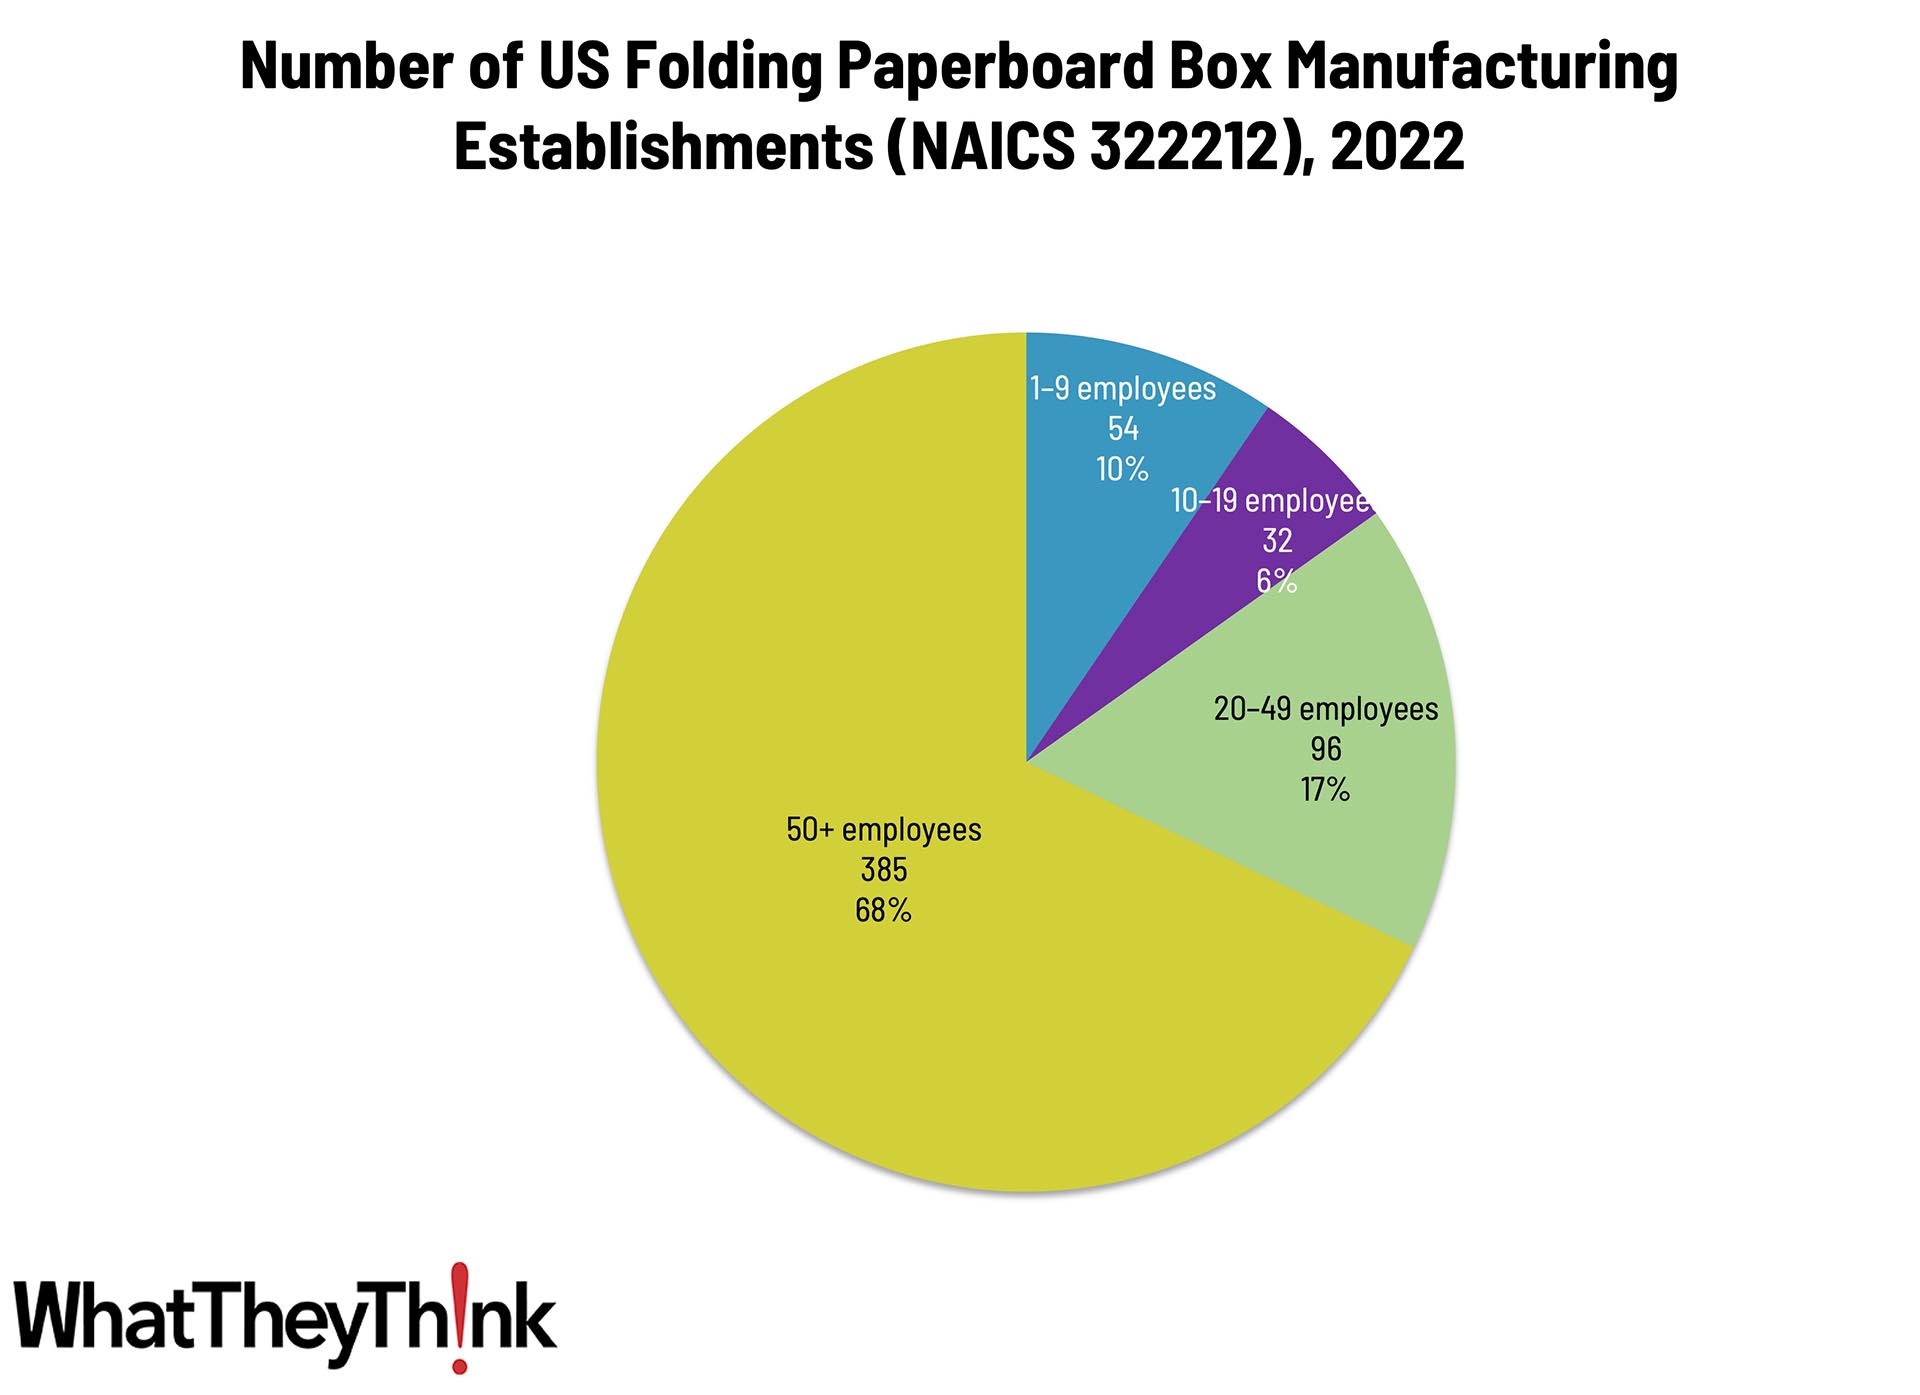
This U.S. industry comprises establishments primarily engaged in converting paperboard (except corrugated) into folding paperboard boxes without manufacturing paper and paperboard.
In this category, digital printing of folding cartons is becoming common, accompanied by laser die-cutting to handle shorter runs. The growth of small boutique and craft businesses—such as microbreweries—has been fueling demand for high-quality, shorter-run packaging materials, especially folding cartons. At the same time, ecommerce driving demand for more and newer types of cartons, and is changing demand for different sizes—for example, cartons that are shipped to consumer vs. shipped to retailer. We are also starting to see “smart packaging,” which incorporates some kind of (often) electronic functionality for tracking or security purposes.
Establishments in this category are larger than we usually see in the printing and publishing industries. Small folding paperboard manufacturers (1 to 9 employees) account for only 10% of all establishments, while large manufacturers (50+ employees) account for more than two-thirds of establishments.
These counts are based on data from the Census Bureau’s County Business Patterns. Every other week, we update these data series with the latest figures. These counts are broken down by printing business classification (based on NAICS, the North American Industrial Classification System).
Next up, we’ll continue through the converting NAICS categories:
- 322219 Other Paperboard Container Manufacturing
- 32222 Paper Bag and Coated and Treated Paper Manufacturing
- 32223 Stationery Product Manufacturing
- 32229 Other Converted Paper Product Manufacturing
- 322291 Sanitary Paper Product Manufacturing
- 322299 All Other Converted Paper Product Manufacturing
To clarify what is included in the 2022 CBP, establishment counts represent the number of locations with paid employees at any time during the year. If an establishment existed at any point during the year, it would be included in the CBP count of the number of establishments for 2022 CBP.
These data, and the overarching year-to-year trends, like other demographic data, can be used not only for business planning and forecasting, but also sales and marketing resource allocation.
This Macro Moment…
Last week, the Bureau of Labor Statistics (BLS) released the Consumer Price Index (CPI) for July, and it showed that inflation is back on the rise.
The Consumer Price Index for All Urban Consumers (CPI-U) increased 0.2 percent on a seasonally adjusted basis in July, after rising 0.3 percent in June, the U.S. Bureau of Labor Statistics reported today. Over the last 12 months, the all items index increased 2.7 percent before seasonal adjustment.
The index for shelter rose 0.2 percent in July and was the primary factor in the all items monthly increase. The food index was unchanged over the month as the food away from home index rose 0.3 percent while the food at home index fell 0.1 percent. In contrast, the index for energy fell 1.1 percent in July as the index for gasoline decreased 2.2 percent over the month.
The index for all items minus food and energy rose 0.3% in July, coming after a 0.2% increase in June.
The CPI numbers are a little troublesome, but it was the Producer Price Index (PPI) that is giving economists cause for concern:
The Producer Price Index for final demand rose 0.9 percent in July, seasonally adjusted, the U.S. Bureau of Labor Statistics reported today. Final demand prices were unchanged in June and moved up 0.4 percent in May. On an unadjusted basis, the index for final demand advanced 3.3 percent for the 12 months ended in July, the largest 12-month increase since rising 3.4 percent in February 2025.
Adds Reuters:
U.S. producer prices increased by the most in three years in July amid a surge in the costs of goods and services, suggesting a broad pickup in inflation was imminent, posing a dilemma for the Federal Reserve.
The $1 million question (and we should adjust that for inflation) is to what extent is PPI predictive of CPI? Does the July spike in PPI mean that August or September (or later) CPIs will spike accordingly? Econbrowser finds that the evidence is mixed, at least when it comes to aggregate PPI and CPI. They cite Williams, (Empirical Economics, 2024) who comments:
we identify several weighted disaggregated [PPI] series that unidirectionally influence or “cause” consumer price inflation providing valuable information for forecasters and policymakers. … we ascertain that three specific disaggregated producer price indices alone account for approximately two-thirds of the variation in consumer price inflation forecasts [over the 2012-2021 period]
These three categories are fuels and related products and power, metals and metal products, and furniture and household durables. (Click through if you want to get into the weeds on this.) For now, we’ll just have to wait and see.