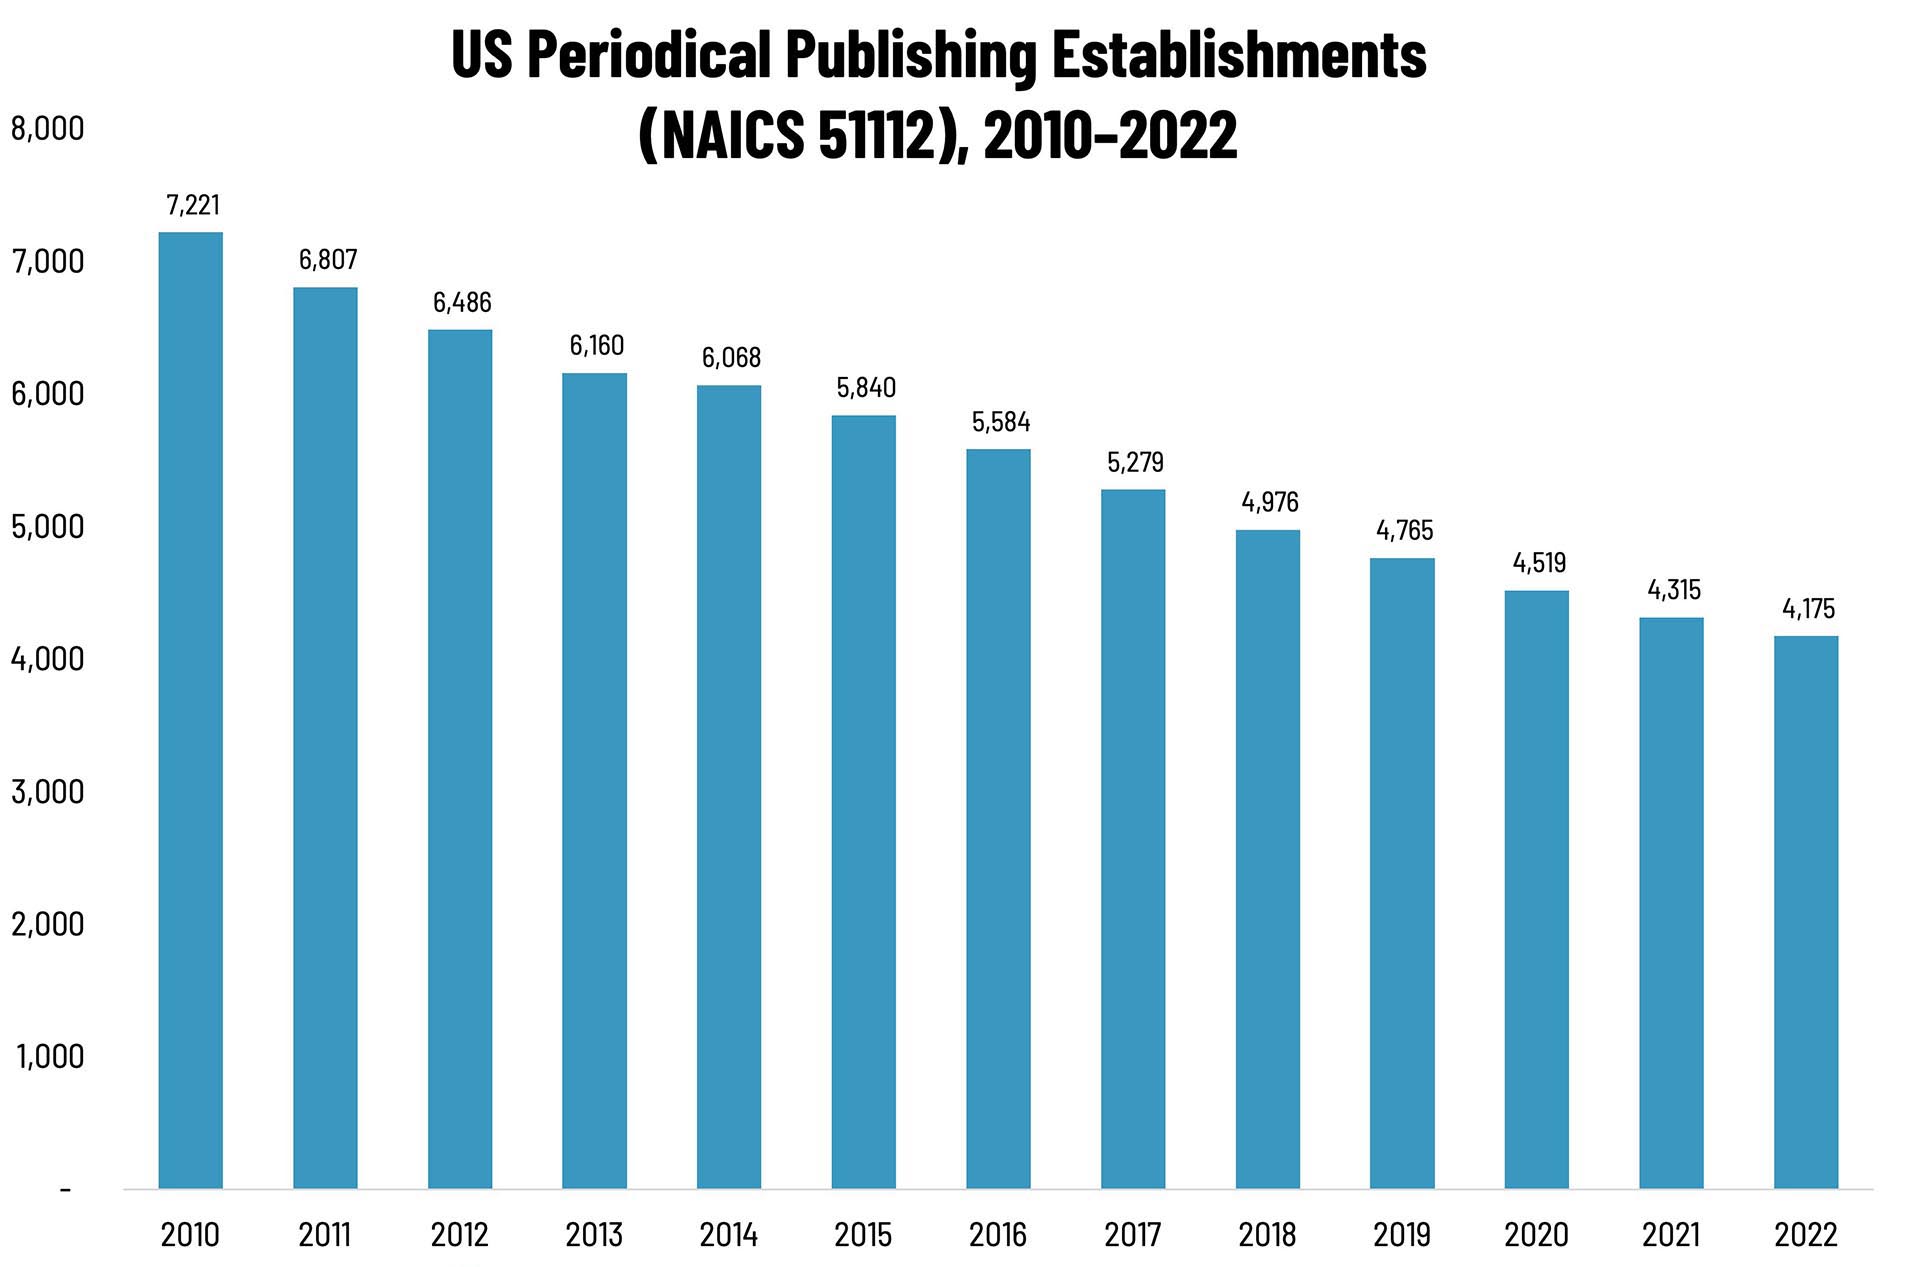
Our Friday data slice’n’dice look at the latest edition of County Business Patterns has been detailing the publishing industries. As 2022 began, there were 4,175 establishments in NAICS 51112 (Periodical Publishing), a decrease of 42% since 2010.
The Bureau of the Census definition for this business classification (officially designated “Periodical Publishers”):
This industry comprises establishments known either as magazine publishers or periodical publishers. These establishments carry out the operations necessary for producing and distributing magazines and other periodicals, such as gathering, writing, and editing articles, and selling and preparing advertisements. These establishments may publish magazines and other periodicals in print or electronic form.
There is a lot going on with periodical publishing; some of it is bad, such as magazines and their publishers shutting down, or merging, or being acquired by other entities. (This was, of course, pre-pandemic.) But there could also be a labelling/identification issue that could be affecting these counts. Focusing on print ignores the fact that magazines are just as invested, if not more so, in their digital/online components. One only has to look at the official trade association to get a sense of the changing times: once called the Magazine Publishing Association, some time ago it changed its name to the Association of Magazine Media and then, in July 2022, merged with the News Media Alliance, the name it goes by now. If these periodical publishers subsequently see themselves as media companies, do they classify themselves in NAICS 51112? Also, Internet publishers, streaming media, and Web search portals have their own classification (NAICS 51913). So some of these establishment declines are very real and portend turmoil in the periodical publishing space, as publications lose circulation/readership as well as advertising (both physical and digital), but also reflect changes in what constitutes a “periodical publisher.”
If there is one bit of good news it’s that the post-COVID establishment count wasn’t down by more than it usually is year-to-year. OK, that’s not the greatest news in the world, but we’ll take what we can get.
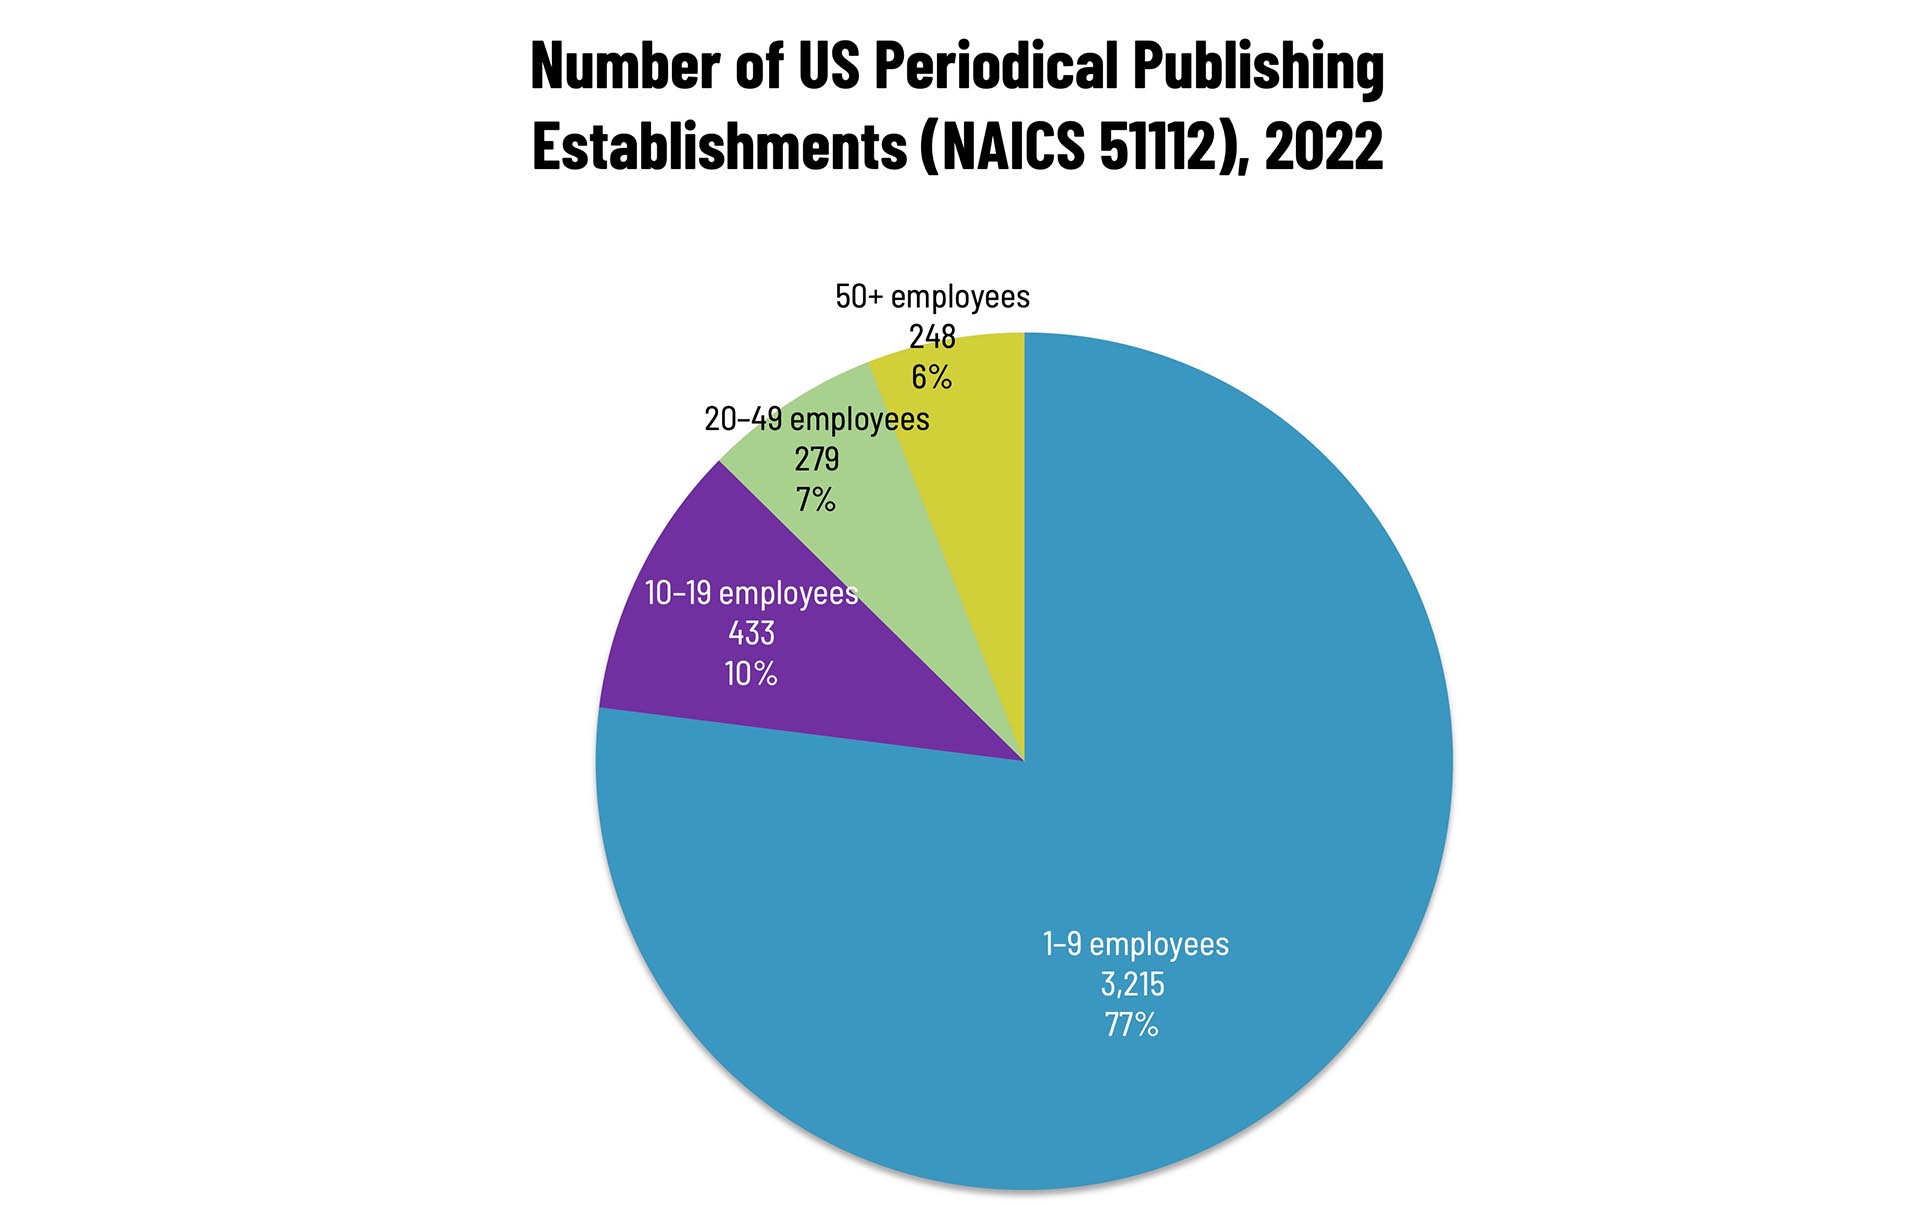
Publishing establishments are concentrated at the lower end of the employee-count spectrum. Small publishers (1 to 9 employees) comprise the bulk of the establishments, accounting for 77% of all establishments, with 10–19-employee establishments accounting for 10%, 20–49-employee establishments accounting for 7%, and 50+-employee establishments at 6%.
These counts are based on data from the Census Bureau’s County Business Patterns. Throughout this year, we will be updating these data series with the latest CBP figures. County Business Patterns includes other data, such as number of employees, payroll, etc. These counts are broken down by commercial printing business classification (based on NAICS, the North American Industrial Classification System). Up next:
- 51113 Book Publishers
- 51114 Directory and Mailing List Publishers
- 51119 Other Publishers
- 511191 Greeting Card Publishers
- 511199 All Other Publishers
These data, and the overarching year-to-year trends, like other demographic data, can be used not only for business planning and forecasting, but also sales and marketing resource allocation.
This Macro Moment…
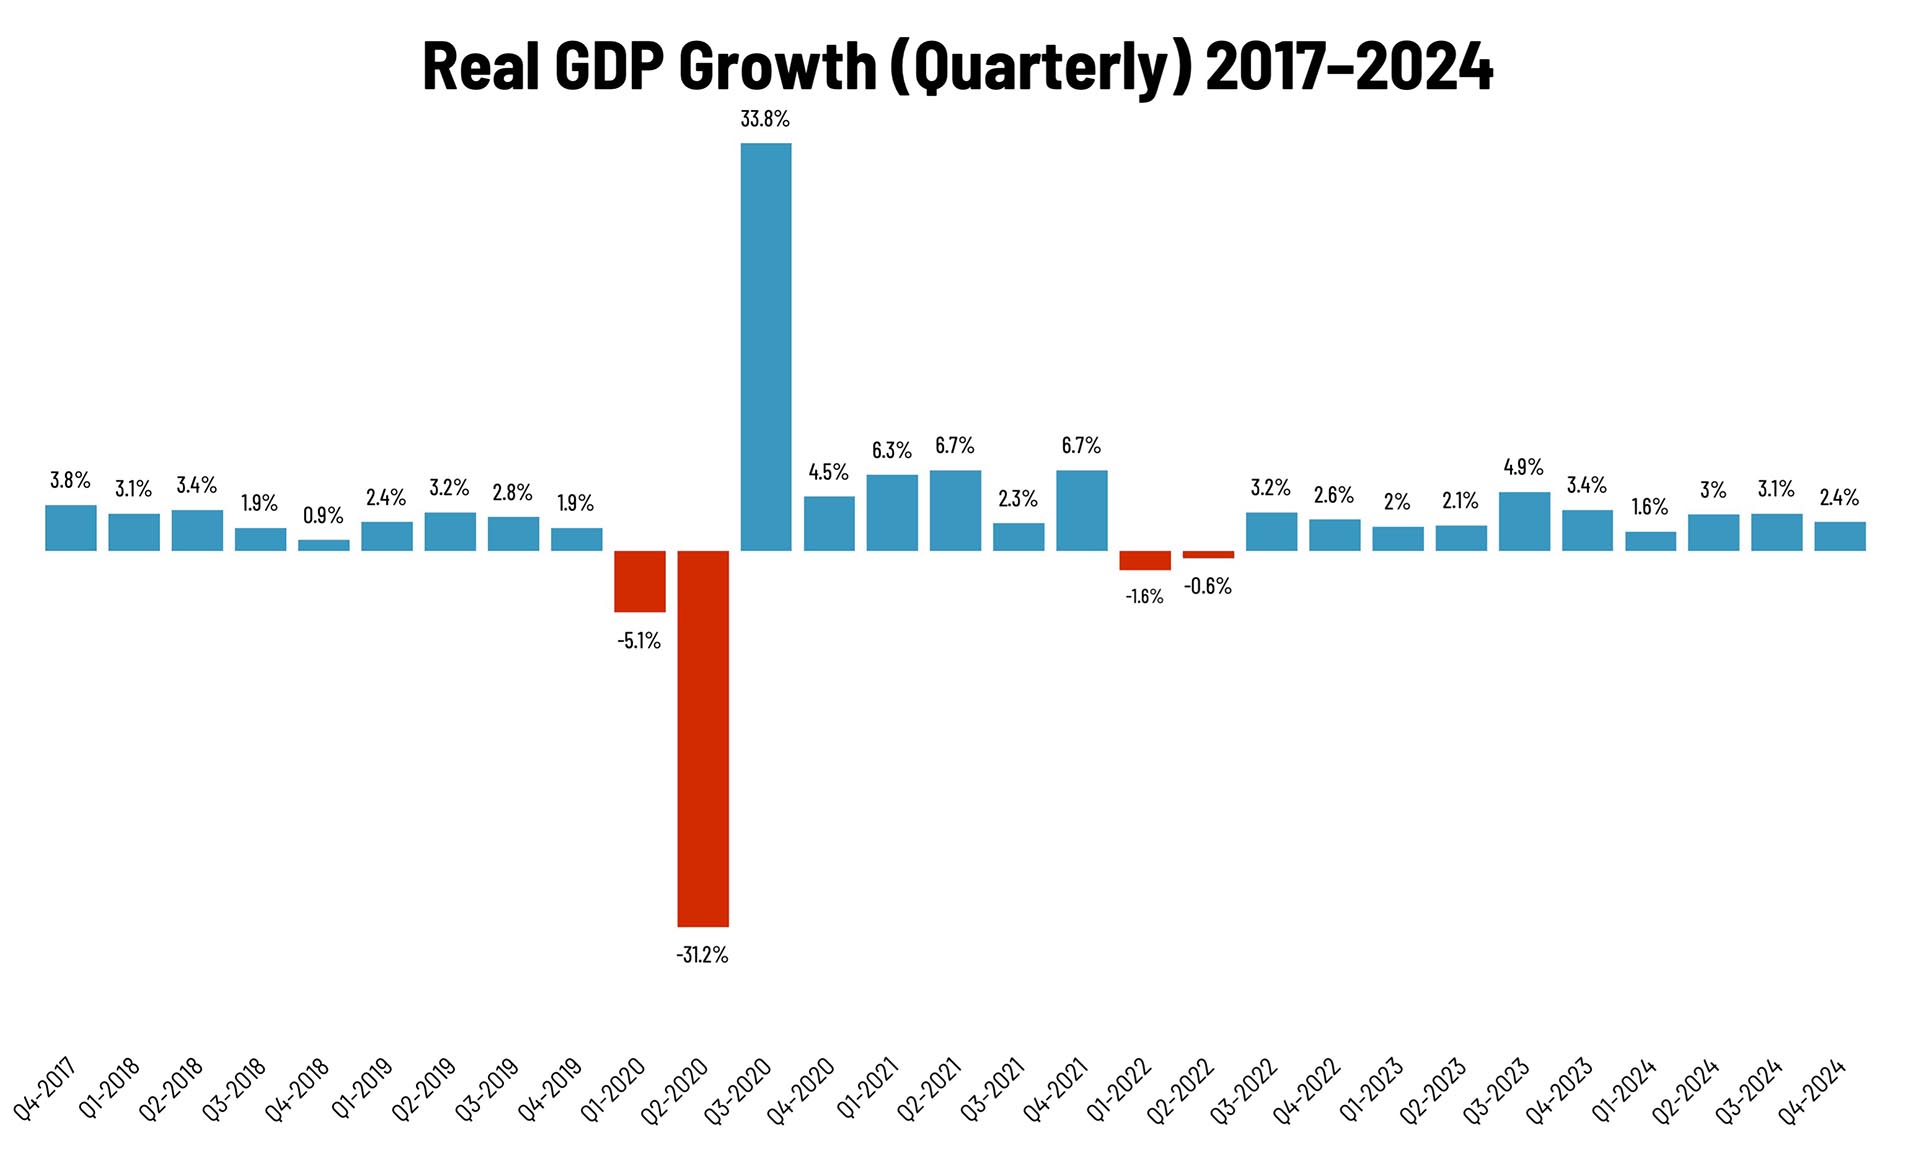
Last week, the Bureau of Economic Analysis announced a revision of Q4 2024 GDP growth. They said:
Real gross domestic product (GDP) increased at an annual rate of 2.4 percent in the fourth quarter of 2024 (October, November, and December), according to the third estimate released by the U.S. Bureau of Economic Analysis. In the third quarter, real GDP increased 3.1 percent.
The increase in real GDP in the fourth quarter primarily reflected increases in consumer spending and government spending that were partly offset by a decrease in investment. Imports, which are a subtraction in the calculation of GDP, decreased.
Source: Bureau of Economic Analysis
As for how Q1 2025 is shaping up, while last month we saw the peril of early forecasts before all precincts have reported in, the current outlook (via Calculated Risk) is:
- Bank of America: 1Q GDP tracking is down from 1.5% q/q to 1.0% q/q (as of March 28).
- Goldman: Q1 GDP tracking estimate down 0.4 percentage points to +0.6%(q/q) (also as of March 28).
And the Atlanta Fed’s GDPNow:
The GDPNow model estimate for real GDP growth (seasonally adjusted annual rate) in the first quarter of 2025 is -2.8 percent on March 28, down from -1.8 percent on March 26. The alternative model forecast, which adjusts for imports and exports of gold as described here, is -0.5 percent.
The BEA’s official advance estimate will be released on April 30. What’ll it be? Place your bets!


